World Models and Language Models, a Philosophy
Abstract
In recent years, research on AI Alignment and the efforts to develop safe yet effective artificial intelligence has surged dramatically. Many of the leading breakthroughs in this area depend heavily on costly human feedback which is difficult to scale, spurring creative approaches such as Constitutional AI and Reinforcement Learning through AI Feedback. At the same time, advances in computational power, scientific computing frameworks, and open-source software have made it easier than ever to simulate diverse aspects of our world.
In this paper, I extend a concept that many researchers have already explored: integrating the natural language capabilities of Language Models with the computational accuracy and simulation strengths of World Models. Although this framework can be applied across a variety of domains, I use public policy development for technology adoption as a case study, tackling the question: can we make policy computable?
 Image generated with DALL·E; prompt: make a futuristic but realistic image that exemplifies “computable policy” as you have just described
In this investigation, I demonstrate that:
- By utilizing increasingly detailed prompts, modern language models serve as an excellent foundation for policy development. However, they often lack the specificity necessary for creating effective or optimal policies.
- With clever prompting, large language models can generate code to simulate specific domains through the creation of a World Model.
- Executing these World Models can lead to emergent behaviors and “new knowledge” that the original language model did not anticipate.
- These concepts can also be employed to create input-output pairs of natural language descriptions processed by the World Model.
This investigation shows a potential path to leverage the ever-increasing power of LLMs for the generation and analysis of policy that can be hopefully more creative, more impactful, and more effective. I conclude with a discussion of the findings as well as a non-exhaustive enumeration of ideas for further work.
Introduction
Many of the incredible advances in AI over the last few years have come as the result of connecting external tools to large language models (LLMs). These tools give the Language Model access to data that wouldn’t necessarily be included in their training corpus and can make them more capable in a given domain. These tools include:
- OpenAI Code Interpreter and IDEs
- LangChain access to APIs
- Nvidia World Foundation Models
- Retrieval Augmented Generation
- Toolformer
- and many, many others,
These tools allow the LLM to access a more rich and diverse set of data and ideas than it would otherwise have access to. In fact, this idea of LLMs as a sort of “glue” for various tasks, data sets, and APIs form the foundational idea of Agentic AI.
This approach however, has seen most of its success in domains that are readily computable such as access to APIs, physics simulations, or database queries. The very nature of “world models” is that their response can be calculated from physics models of the objects and agents in the virtual world. Another term for these are “Digital Twins” that simulate the behavior of a physical factory, smart city, or other physical system for example. I believe the reason for this rests in the fact that while they can be computationally expensive, we have really good mathematical models for many of these physical systems and thus they lend themselves to computation. This leads to my first conjecture about AIs and World Models:
Conjecture 1: Large Language Models often excel at tasks where the accuracy of their output is relatively easy to verify. Testing whether code compiles, having a bilingual human verify a translation, determining if re-written prose sounds better, or a generated poem conforms to rhyme and meter, are all tasks that can be done by humans or verified computationally with relative ease. This makes reinforcement learning more tractable because we can plainly see (or test) if the output is correct.
However, there remain many domains where verifying or testing an LLM’s output is more challenging, subjective, and less obvious. For instance, assessing whether a public policy recommendation will achieve its intended effect, determining if a social media post will encourage civil discourse or cause harm, or evaluating if a social program will reach its target audience is not as straightforward. Unlike code, these outputs cannot be “compiled” and, though they may appear coherent, could have unintended secondary effects. While LLM-generated policy recommendations can be detailed and eloquent, they result from “next token prediction” by a transformer network rather than thoughtful simulation or deliberation on policy outcomes.
If we could make societal foundations such as law, policy, regulations, and cultural texts more computable, we might automatically generate vast training datasets. This would embed computable policy knowledge into language models during training, leading to a future where advanced AI models possess precise, computational knowledge of complex social, cultural, and civic domains.
From this we arrive at this works foundational motivating question:
Can we make policy computable?
Prior Work
The concept of using complex computational models for simulating social, economic, policy, and civic systems is well-established, with numerous examples demonstrating its application in guiding public policy and decision-making. Notable works in this area include:
- John Sterman (2000). Business Dynamics: System Thinking and Modeling for a Complex World. New York: McGraw-Hill.
- *Stephen Wolfram (2016), Computational Law, Symbolic Discourse and the AI Constitution
- Edward J Walters (2019). Data Driven Law
- MIT Computable Law Project
These examples illustrate that the idea is not new and has attracted the attention of leading thinkers in computing and law. The roots of computable policy and computational language can be traced back to antiquity with Aristotelian logic and gained momentum during the scientific revolution with philosophers like Leibniz and John Wilkins who explored foundational languages of discourse.
As artificial intelligence, especially large language models (LLMs), increasingly infiltrate various societal domains, it’s vital to recognize their limitations in policy generation. Addressing these shortcomings and suggesting solutions is crucial. Beyond the primary exploration of computable policy, this work seeks to investigate two relatively novel avenues:
Leveraging LLMs to Create and Learn from “World Models”: Can an LLM be used to construct a “world model” and, through simulations, acquire knowledge it would otherwise lack? This involves determining if an LLM, with strategic prompting, can generate computational world models, configure specific simulation runs, and then learn from the outcomes. If successful, this would suggest a form of “weak-to-strong-self generalization,” adapting Weak-to-Strong Generalization, where the LLM could create and learn from its own computational world model. Such self-generalization might have significant implications for alignment as we delve deeper into agentic systems.
Designing AI Policy for Societal Equality: Can we use computational models and LLMs to develop policies that enhance AI equality in society? The year 2025 is shaping up to be pivotal for both public policy and AI technological development. The way AI systems are adopted, distributed, and developed in different societal sectors could have lasting impacts, potentially reinforcing early technological distributions. It’s particularly important to use these rapidly advancing technologies to craft AI policy and regulation that uphold values like freedom, equality, and democracy.
Methodology
In this paper, I will explore these three questions:
- Can we make policy computable?
- Can an LLM generate its own world model for policy computation? and
- Can we use LLMs and this generated world model to explore or design policy to increase the adoption of AI tech and hence digital and AI literacy and equality?
To explore these questions, I will break my investigation into the following steps:
-
First I will explore current AI models (gpt4o, claude 3.5 haiku, and ollama3.1:8b) and their capability in designing a policy to increase the adoption of AI. I will examine the qualitative features of the models at progressively higher levels of detail in the policy. This initial method of model comparison is illustrated in the following figure:
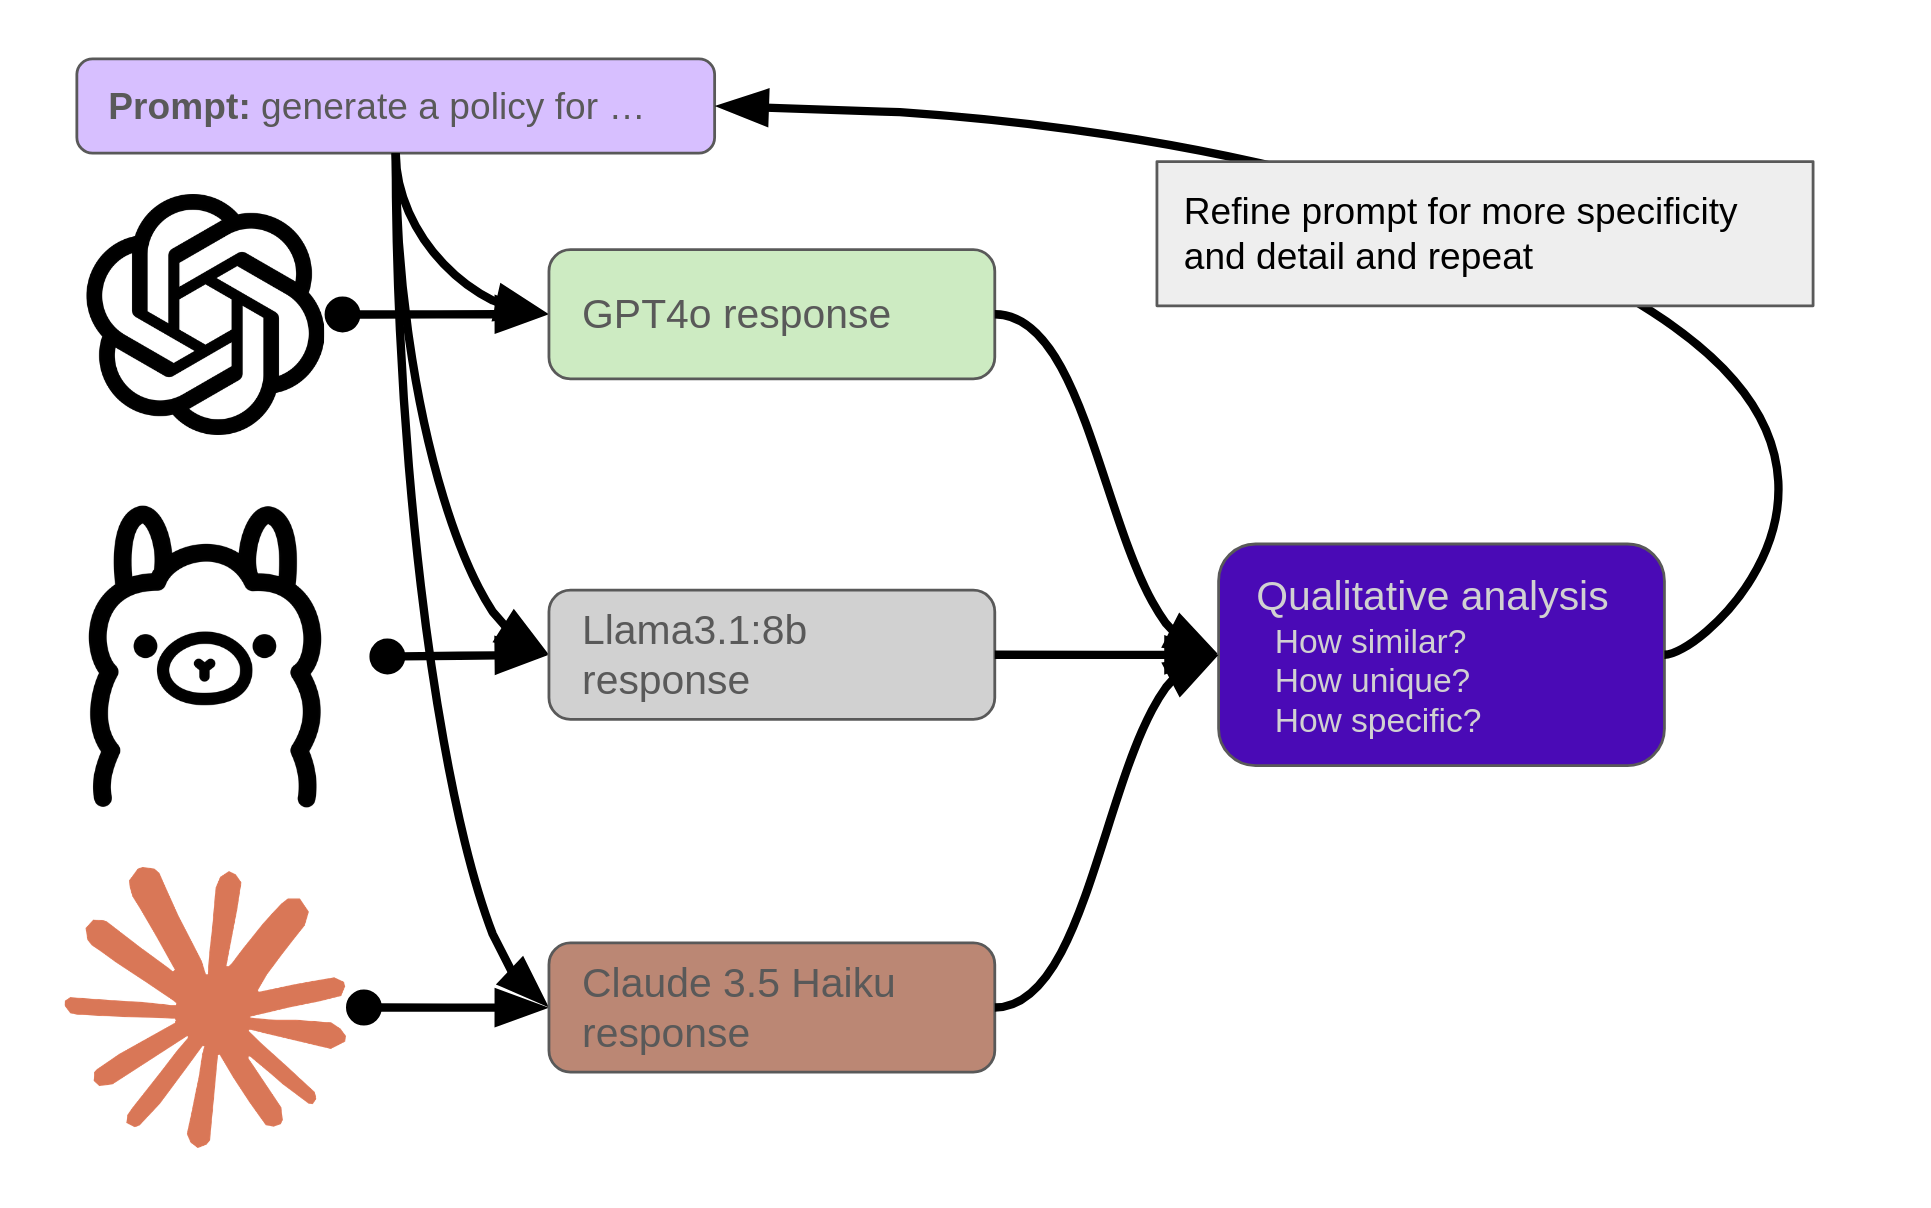 LLM Based Policy Generation and Iteration
 -
Next, I will compare the model responses for different scenarios, such as AI education policy in two distinct municipalities. I anticipate that these differing social contexts should lead to significant variations in policy recommendations and outcomes. By examining these diverse situations, I aim to make qualitative comparisons between them. My hypothesis is that despite their specificity and detail, the LLMs will exhibit minimal differences when given the same prompt, as well as few distinctions in responses between the two municipalities. This approach is illustrated below:
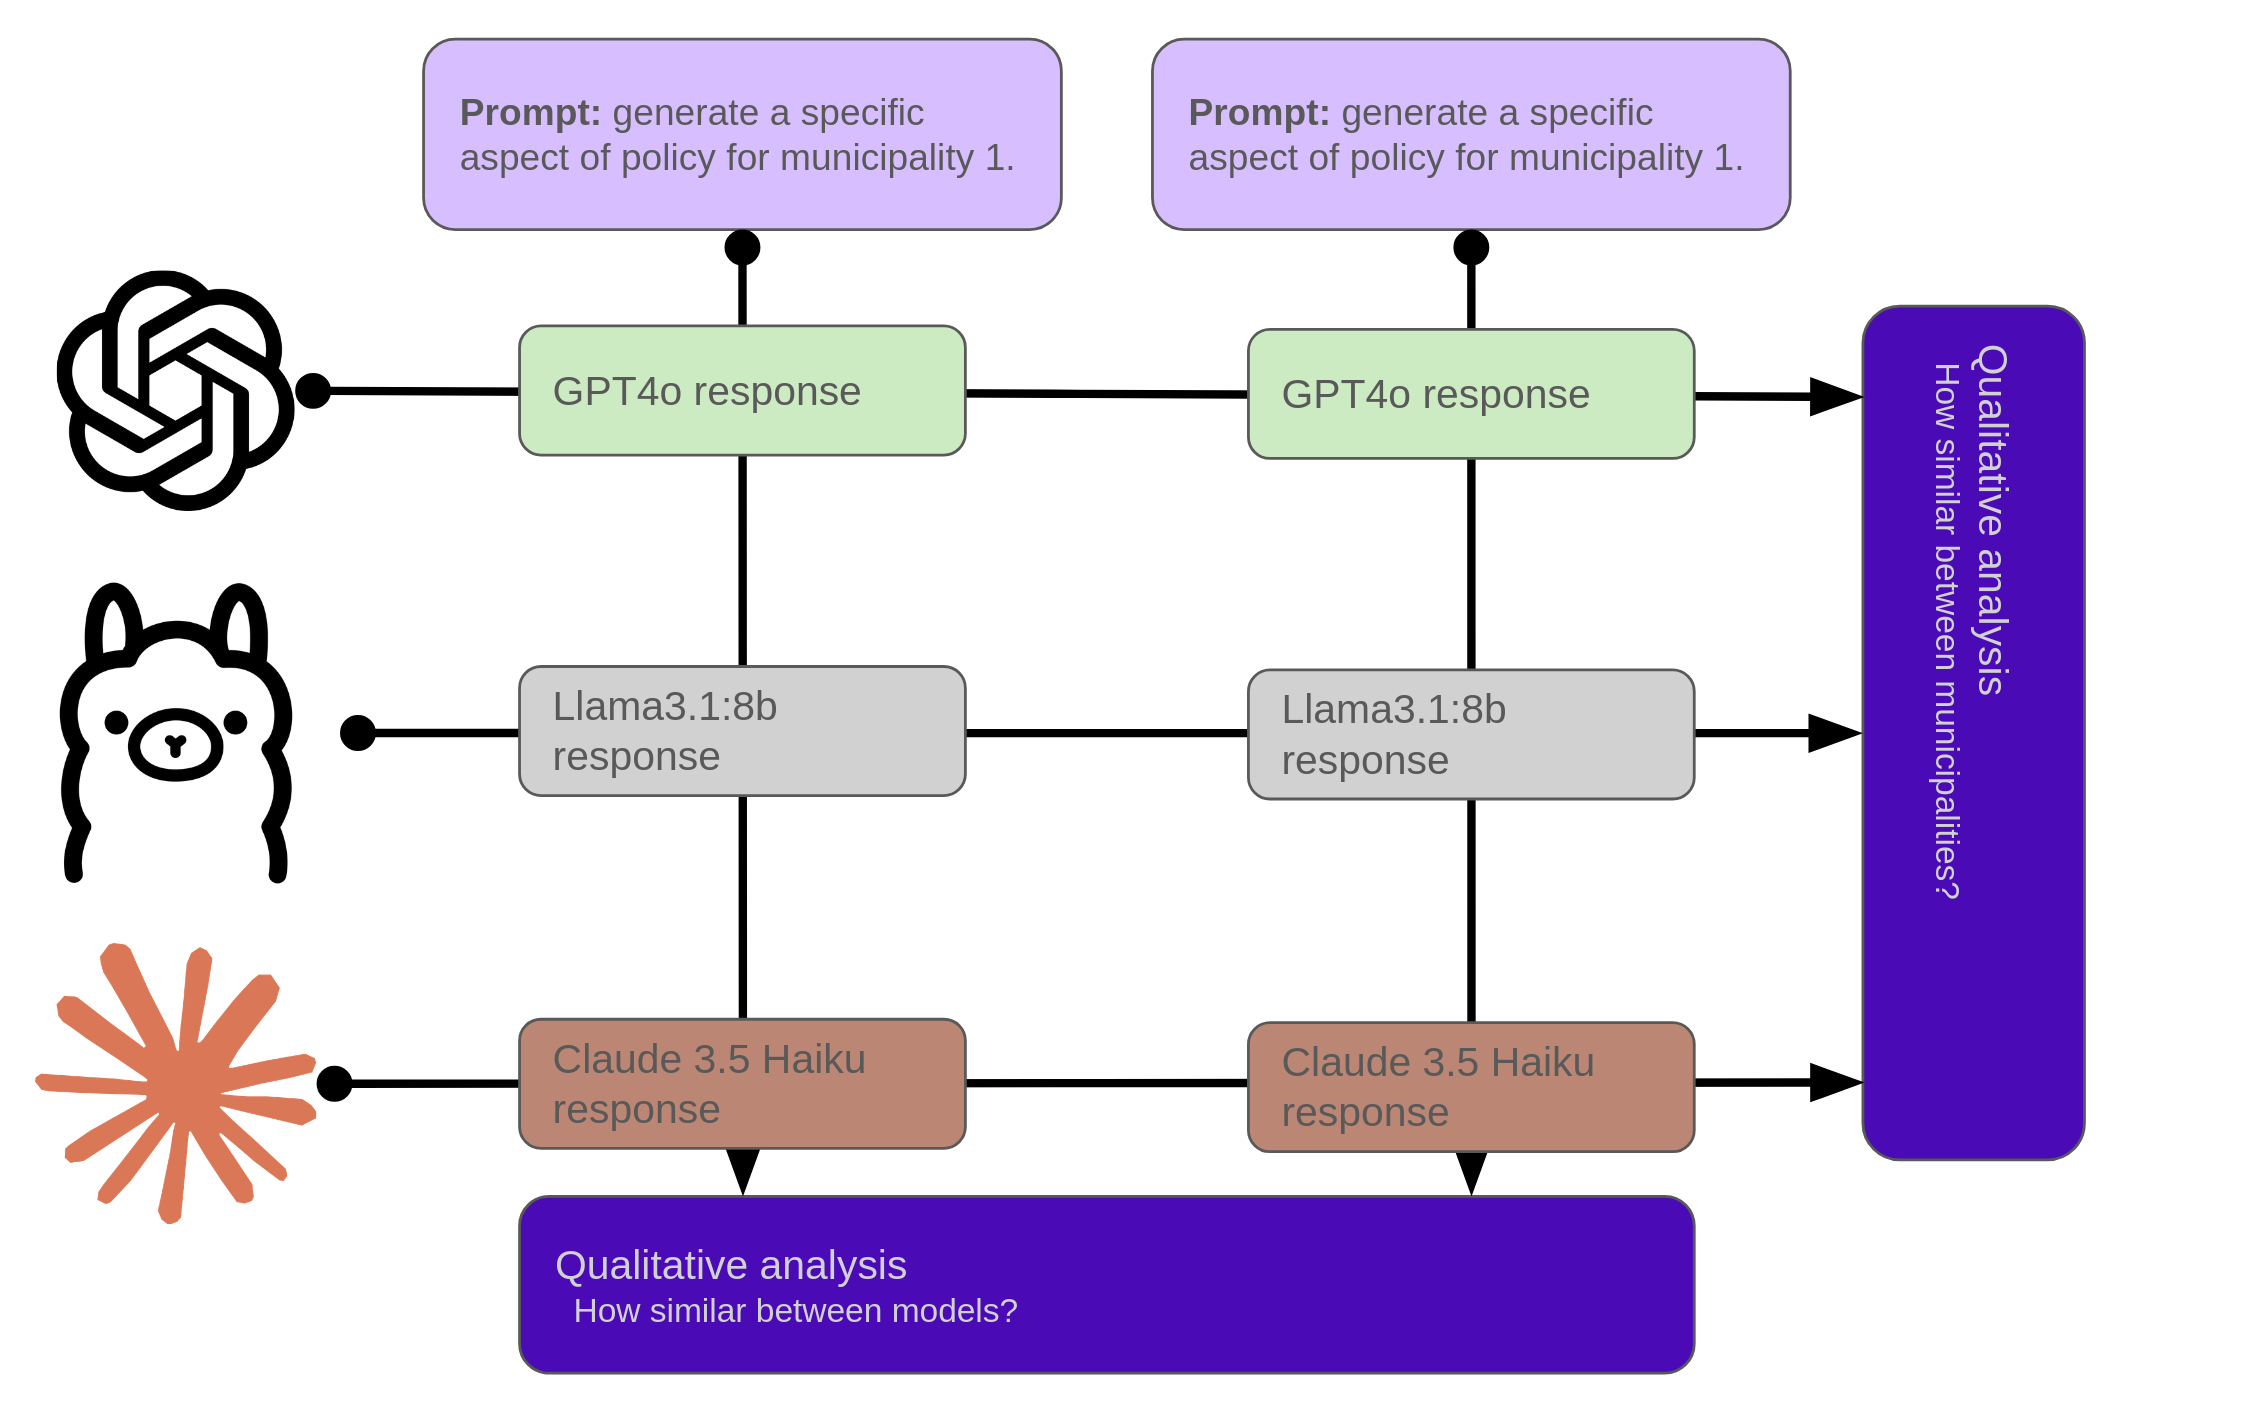 LLM Based Policy Generation for Specific Municipalities
 -
Next, I will explore using a single LLM to generate a policy world model to simulate AI adoption policy impacts. For this I will be using a rather simple toy model developed in agentpy. Agentpy is a python module for simulating simple agent-based networks. I should note that these are not AI agents, but rather simple rules based agents. Even given this consideration, interesting and emergent behavior is often observed in models developed in agentpy. I will heavily leverage LLMs (specifically gpt4o and o1) in the creation of a progressively more complex agent based world model. This process is pictorially shown below.
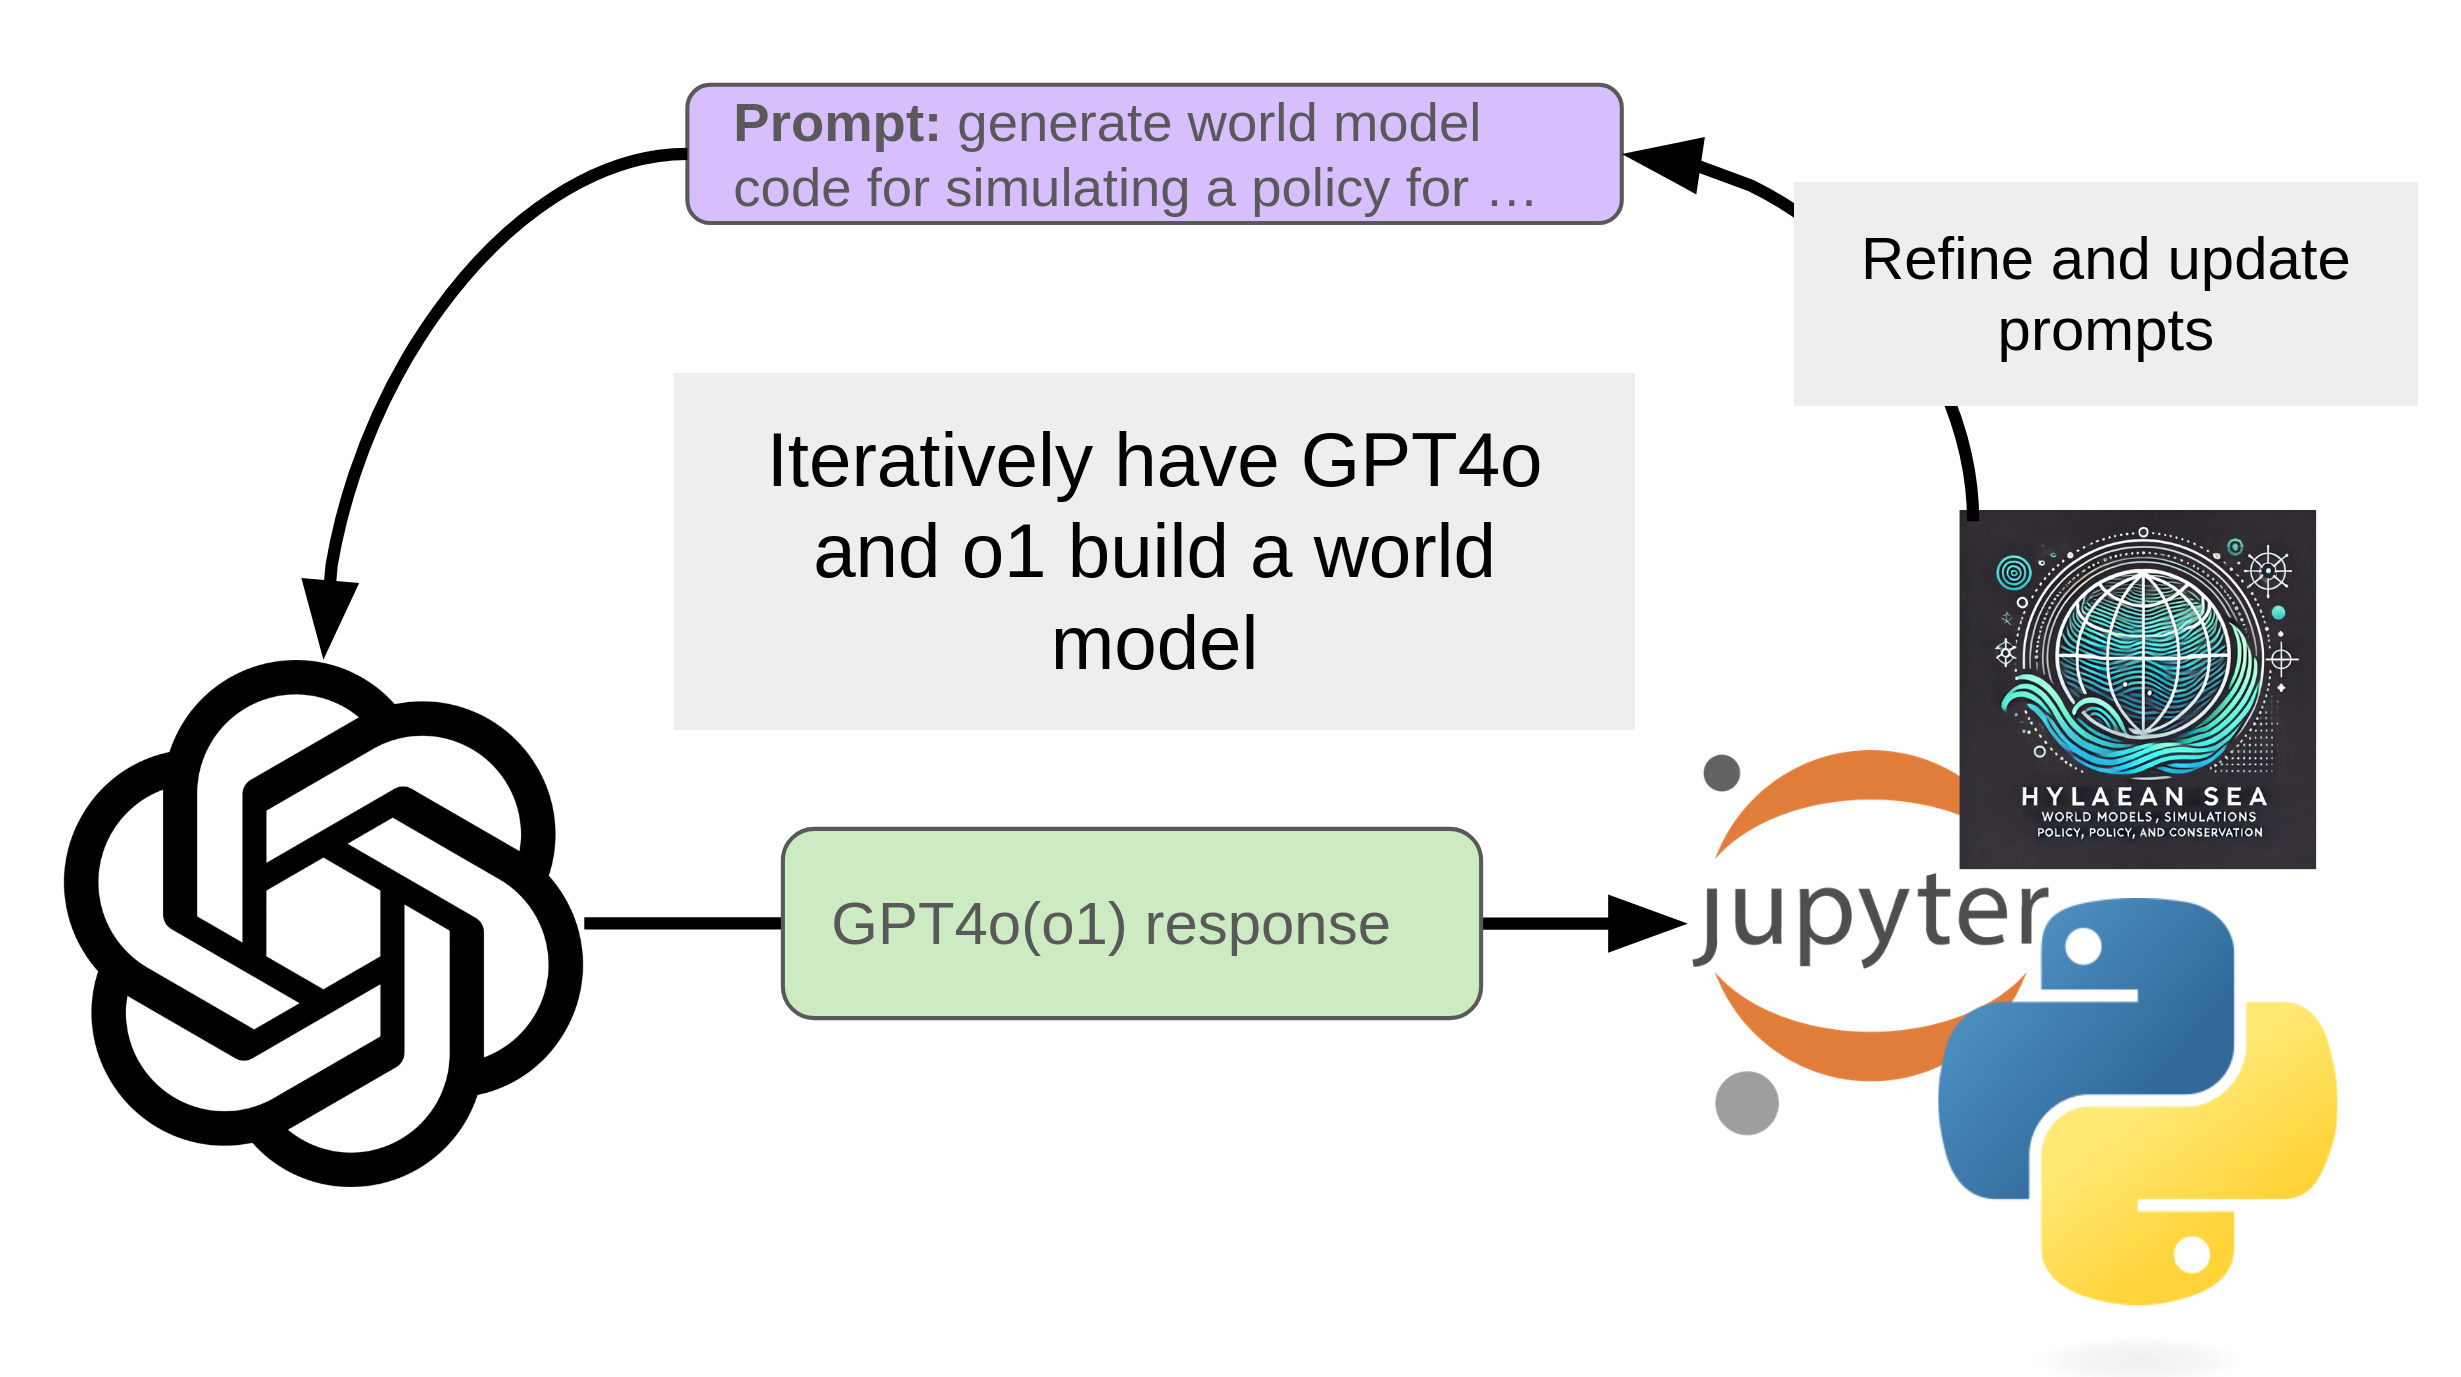 LLM Generated World Model
 -
Once the world model has been constructed, I will utilize large language models (LLMs) to establish the initial conditions and parameters for the agentpy simulation. Additionally, I will interpret the numerical outcomes using natural language for a qualitative understanding. My hypothesis is that the LLM can create an agent-based world model simulation, allowing it to acquire knowledge beyond its existing base model. This process is depicted below:
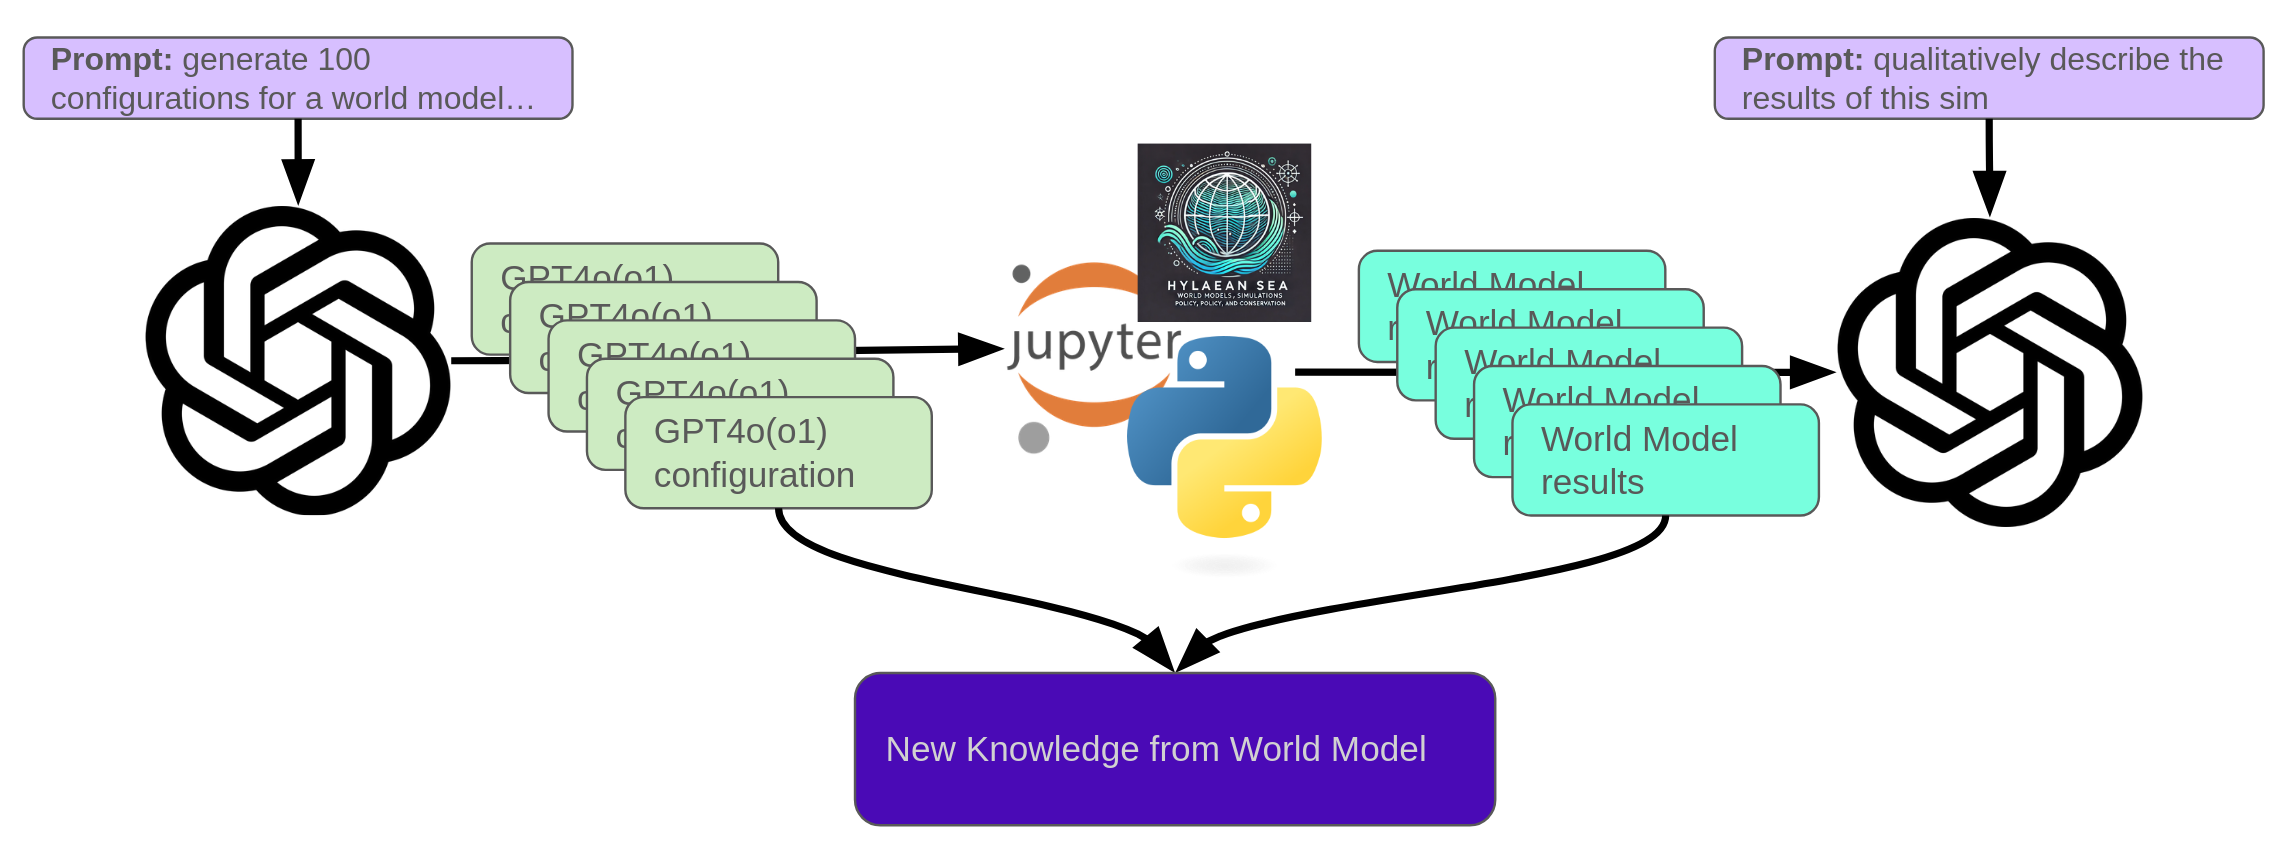 Figure 4: New Knowledge is potentially generated from the World Model interacting with the Language Model
My hope is that through these steps I can demonstrate how LLMs can be used to not only generate rich world models for public policy recommendation and analysis, but also by using AI tech adoption as the exemplar policy in the above steps, develop some intuition about how we might design policy to increase that adoption.
A quick disclaimer: I have an interest in public policy and public tech policy, but no formal background in these areas. I will be exploring simplified models that do not fully capture the complex dynamics, economics, and interactions involved in public policy analysis. However, I believe this project could serve as an intriguing starting point for generating world models. If I can motivate true public policy and social computing professionals to consider some of my proposed ideas, this will be a success. With that said… let’s get started!
Generating Public Policy with LLMs
In this first step I generated public policy recommendations at different levels of detail and evaluated the results for their qualitative strengths and weaknesses, as well as differences and similarities between models. For clarity, all the prompts and model responses (ChatGPT-4o, ChatGPT-o1, llama3.1:8b, and Claude 3.5 Haiku) will be highlighted with their respective color. Recalling the figure from before, three models will be given the same prompt and then the differences and similarities between them will be analyzed. This analysis will look to challenge the hypothesis that the responses will be substantively similar.
LLM Based Policy Generation and Iteration
To begin, I will start with a high level, abstract prompt about generating a national level policy, and in subsequent prompts will become more detailed.
High level National Policy
Public Policy: “AI for All Initiative: Accelerating the Adoption of Artificial Intelligence Across Sectors”
Objective:
To maximize the adoption, responsible use, and benefits of artificial intelligence (AI) across all sectors of society while ensuring equitable access, economic growth, workforce preparedness, and ethical governance.
Key Policy Components:
1. Infrastructure Development
- AI Hubs: Establish AI innovation hubs in key regions to provide centralized resources, training, and R&D facilities. Partner with universities, private organizations, and governments to build these hubs.
- Cloud Computing Accessibility: Subsidize access to high-performance computing (HPC) platforms, cloud AI services, and data storage for startups, SMEs, and public organizations.
- 5G and IoT Expansion: Accelerate the deployment of 5G networks and IoT infrastructure to enhance real-time AI applications in areas like healthcare, transportation, and agriculture.
2. Workforce and Education
- AI Education in Schools: Introduce AI-focused curricula in schools starting at the primary level, emphasizing critical thinking, coding, and ethics.
- Upskilling Programs: Fund large-scale, government-sponsored upskilling and reskilling programs for workers in at-risk industries, focusing on AI literacy and related technical skills.
- AI Fellowships and Grants: Provide scholarships, fellowships, and grants for students and professionals pursuing careers in AI and adjacent fields.
- Public AI Awareness Campaigns: Run national campaigns to demystify AI, highlight its benefits, and build trust in AI systems.
3. Sector-Specific Implementation Programs
- Healthcare: Develop national frameworks for AI-driven healthcare systems, such as predictive diagnostics, personalized treatment plans, and telemedicine platforms.
- Agriculture: Promote AI for precision agriculture, crop monitoring, and resource optimization to enhance food security and reduce environmental impact.
- Transportation: Encourage the adoption of AI-powered systems for traffic management, autonomous vehicles, and public transit optimization.
- Small Businesses: Create an “AI Adoption Fund” offering grants and low-interest loans to SMEs for integrating AI into their operations.
- Public Services: Deploy AI tools for improving the efficiency of government services, public safety, and environmental monitoring.
4. Ethical and Regulatory Frameworks
- AI Governance Standards: Develop and enforce ethical AI principles focusing on transparency, fairness, accountability, and privacy.
- Bias Mitigation: Establish independent review boards to evaluate and mitigate AI bias in critical applications like hiring, lending, and law enforcement.
- Data Privacy: Strengthen data protection laws to ensure that individuals’ data is used ethically and securely in AI systems.
- Explainable AI Mandates: Require that high-impact AI applications provide transparent and explainable outputs.
5. Research and Development (R&D)
- National AI R&D Fund: Allocate a significant budget to fund breakthrough research in AI technologies, with a focus on societal benefit.
- Public-Private Partnerships: Foster collaborations between government, academia, and industry to accelerate AI innovation.
- Open-Source AI: Promote the development and adoption of open-source AI frameworks to democratize access and reduce barriers for innovators.
6. International Collaboration
- Global AI Standards: Work with international organizations to develop and adopt global AI standards for ethics, safety, and interoperability.
- Knowledge Sharing: Participate in global AI knowledge-sharing platforms and partnerships to access cutting-edge research and practices.
- Technology Transfer: Facilitate AI technology transfer to developing nations to ensure global equity in AI benefits.
7. Incentives for Adoption
- Tax Benefits: Offer tax credits and deductions for organizations adopting AI technologies or conducting AI R&D.
- Recognition Programs: Create awards and certifications for businesses and public organizations that demonstrate exemplary use of AI to solve societal challenges.
- Procurement Policies: Implement government procurement policies that prioritize vendors leveraging AI to improve efficiency and sustainability.
8. Monitoring and Evaluation
- Impact Assessments: Regularly assess the societal, economic, and environmental impact of AI deployment.
- AI Readiness Index: Publish an annual “AI Readiness Index” to track progress in AI adoption across sectors and regions.
- Feedback Mechanisms: Establish channels for public and industry feedback to continuously refine AI-related policies.
Expected Outcomes:
- Enhanced productivity and innovation across all sectors.
- Creation of new industries and job opportunities, mitigating the risks of automation displacement.
- Improved public services, healthcare, and environmental sustainability.
- A globally competitive AI ecosystem with strong ethical foundations.
This policy framework aims to ensure that AI becomes a transformative tool for societal progress while addressing risks and ensuring inclusivity.
Public Policy: “Accelerating the Adoption of Artificial Intelligence for Economic Growth and Social Progress”
Objective: To encourage the widespread adoption and utilization of Artificial Intelligence (AI) across various sectors of society, fostering economic growth, improving social outcomes, and enhancing quality of life.
Key Principles:
- Invest in AI Education and Training: Develop a comprehensive education system that equips students with AI literacy and programming skills, preparing them for the AI-driven workforce.
- Foster an Enabling Regulatory Environment: Implement policies that facilitate AI innovation while ensuring data protection, privacy, and safety.
- Promote Public-Private Partnerships: Encourage collaboration between governments, businesses, research institutions, and academia to accelerate AI adoption.
- Develop Infrastructure for AI Adoption: Invest in high-speed computing infrastructure, data storage, and networking capabilities to support AI development and deployment.
Recommendations:
- Establish an AI Advisory Council: Form a council comprising experts from various fields to provide guidance on AI policy development and implementation.
- Create an AI Innovation Fund: Provide grants for businesses, startups, and research institutions to develop and deploy AI solutions addressing societal challenges.
- Implement AI-Specific Tax Incentives: Offer tax breaks to companies investing in AI R&D, training programs, or job creation related to AI adoption.
- Develop AI-Related Workforce Development Programs: Launch apprenticeships, vocational training, and certification programs for workers transitioning into AI-related roles.
- Conduct Regular AI Impact Assessments: Monitor and evaluate the effects of AI on employment, skills, and industry competitiveness, informing policy adjustments as needed.
Sector-Specific Recommendations:
- Healthcare: Invest in AI-powered healthcare platforms, electronic health records systems, and medical imaging analysis tools to improve patient outcomes and streamline care delivery.
- Transportation: Promote the adoption of autonomous vehicles, traffic management systems, and smart logistics solutions to enhance safety, efficiency, and mobility.
- Education: Develop AI-driven educational platforms for personalized learning, adaptive curricula, and virtual teaching assistants to support student success.
- Energy and Environment: Leverage AI in renewable energy integration, energy efficiency monitoring, and environmental monitoring systems to mitigate climate change impacts.
- Agriculture: Utilize precision agriculture techniques, AI-optimized crop management, and livestock tracking systems to boost food production, reduce waste, and enhance resource usage.
Key Performance Indicators (KPIs):
- AI Adoption Rate: Monitor the number of businesses and individuals adopting AI solutions across various sectors.
- Job Creation in AI-Related Fields: Track job growth in AI-related industries, such as data science, software engineering, and research.
- AI Research Output: Measure the increase in peer-reviewed publications, patents, and innovations related to AI development.
- Economic Growth: Assess the impact of AI adoption on GDP growth, productivity, and competitiveness.
- Social Outcomes: Evaluate AI’s effects on education outcomes, healthcare access, and environmental sustainability.
Implementation Plan:
- Short-Term (0-2 years):
- Establish the AI Advisory Council
- Launch AI Innovation Fund
- Develop workforce development programs
- Medium-Term (2-5 years):
- Implement tax incentives for AI-related investments
- Conduct regular AI impact assessments
- Develop sector-specific AI strategies and pilots
- Long-Term (5+ years):
- Evaluate policy effectiveness and adjust as needed
- Expand the AI Innovation Fund and workforce development programs
- Establish a national AI strategy to guide future policy decisions
Budget Allocation:
- AI Education and Training: 20%
- Regulatory Framework Development: 15%
- Public-Private Partnerships: 20%
- Infrastructure Development: 25%
- Research and Development: 10%
This comprehensive public policy aims to accelerate the adoption of AI across various sectors, addressing societal challenges while fostering economic growth and social progress.
Here’s a comprehensive AI Adoption and Integration Public Policy Framework:
National AI Integration and Development Policy
Core Objectives
- Accelerate responsible AI adoption across public and private sectors
- Develop robust national AI infrastructure and capabilities
- Create adaptive regulatory frameworks supporting innovation
- Ensure ethical and safe AI implementation
Key Policy Recommendations
1. National AI Education and Workforce Development
- Mandate AI literacy and skills training in K-12 and higher education curricula
- Create federal grants for AI skills retraining programs
- Develop standardized AI competency certification frameworks
2. Research and Innovation Incentives
- Establish substantial research funding for AI technologies
- Provide tax credits for AI R&D investments
- Create public-private AI innovation partnerships
- Support emerging AI startups through dedicated venture funding
3. Sector-Specific AI Integration Strategies
- Healthcare: Accelerate AI diagnostic and treatment optimization
- Government: Implement AI for administrative efficiency and service delivery
- Manufacturing: Support AI-driven automation and process optimization
- Agriculture: Develop precision farming and crop management technologies
- Transportation: Advance autonomous vehicle and logistics technologies
4. Regulatory Framework
- Create adaptive AI governance structures
- Develop clear ethical guidelines for AI development
- Establish robust data privacy and algorithmic transparency standards
- Design risk assessment protocols for high-impact AI applications
5. Infrastructure Investment
- Build high-performance computing networks
- Develop secure, interoperable AI data platforms
- Support advanced semiconductor and computational infrastructure
6. International Collaboration
- Lead global AI standards and cooperation initiatives
- Facilitate international AI research exchanges
- Promote responsible AI development principles globally
Implementation Mechanism
- Create a cross-ministerial AI Strategy Board
- Annual policy review and adaptation process
- Dedicated federal AI implementation budget
The policy aims to position the nation as a global leader in responsible, innovative AI integration across society.
The responses of each model to this admittedly broad prompt can be found in the boxes above. Key similarities include an emphasis on education and upskilling, governance and monitoring frameworks, incentives for AI implementation, and infrastructure development. A few notable observations on the differences:
-
ChatGPT-4o was the only one to mention 5G and IoT. I’m not entirely convinced that these technologies constitute critical infrastructure for boosting AI adoption. Consequently, I question their inclusion in this policy recommendation. I suspect that their inclusion in 4o’s response is likely due to the frequency these technologies are mentioned in internet text.
-
Llama3.1:8b was the only one to mention a specific timeline and budget (even though the budget breakdown was given as percentages).
-
Two of the three mention international collaboration with llama being the exception.
-
Only ChatGPT referenced open-source software development, which I find particularly intriguing given that OpenAI initially promoted open-source development but has since stepped back from this ideal. In contrast, while Meta releases its models with open weights (which are more restricted than true open source), it did not mention open source in its response. In a separate study, it would be worthwhile to explore how various models approach open-source software suggestions and concepts.
-
All of them mention AI education and upskilling, however with different levels of detail. We will focus on education in the next level of policy inquiry.
I also found it interesting to further prompt each model about a unique aspect of their response:
- When further prompts to Claude asked why it chose to focus on high-performance computing and if centralized or decentralized data centers were preferred, it replied:
Distributed HPC approach is superior. Reasons:
- Decentralization benefits
- Reduces single point of failure risks
- Democratizes computational access
- Increases overall national computational resilience
- Local ecosystem advantages
- Universities can specialize in domain-specific research
- K-12 schools develop computational skills early
- Local research groups/communities drive innovation
- Reduces geographical computational inequality
- Cost-effectiveness
- Shared infrastructure reduces individual investment burdens
- Allows flexible, modular computational resource scaling
- Encourages collaborative computational resource sharing
Recommended strategy: Create national framework incentivizing distributed HPC network with standardized interoperability protocols, while providing funding and technical support for local infrastructure development.
- When further prompted about the most important piece of its policy, ChatGPT-4o replied:
Why Focus on Education, Awareness, and Workforce Readiness?
- Breaking Barriers to Adoption:
- Many people and organizations hesitate to adopt AI because they don’t understand it, feel intimidated, or perceive it as a threat to jobs.
- By demystifying AI and building widespread AI literacy, individuals and organizations are more likely to adopt the technology.
- Empowering Workers and Businesses:
- Without a workforce equipped to use AI, even the most advanced technologies will remain underutilized.
- Upskilling workers and supporting SMEs to integrate AI ensures broad economic participation and reduces fears of automation-driven unemployment.
- Creating Trust and Social Buy-In:
- A lack of trust in AI systems is a key adoption barrier. Public education campaigns that show tangible benefits of AI and address concerns (e.g., job displacement, privacy) build public confidence.
- Expanding the Talent Pool:
- Making AI education accessible increases the number of people who can develop, implement, and manage AI systems, ensuring a sustained pipeline of talent for economic growth.
Key Actions to Prioritize:
1. National AI Literacy Programs
- Launch free or low-cost online and offline AI training for all ages, from basic AI concepts to advanced technical skills.
- Partner with tech companies and universities to create tailored content for diverse groups (e.g., students, business leaders, workers in at-risk industries).
2. Upskilling the Workforce
- Provide government-funded, industry-aligned AI reskilling programs for workers in automation-prone sectors.
- Offer incentives for businesses to retrain employees instead of replacing them with AI.
3. AI Awareness Campaigns
- Run large-scale, engaging public campaigns showcasing real-world examples of AI improving lives (e.g., healthcare innovations, safer transportation, personalized education).
- Emphasize how AI creates new job opportunities and reduces repetitive, mundane work.
4. Support for Small Businesses and Entrepreneurs
- Launch “AI Starter Kits” for SMEs, including easy-to-use tools, training, and access to consultants, helping them integrate AI without requiring advanced technical expertise.
- Subsidize AI implementation costs for small businesses to lower the financial barrier.
5. Early AI Education
- Embed AI concepts into primary and secondary school curricula to prepare future generations.
- Promote AI clubs, hackathons, and competitions for young learners to build interest and skills early.
Expected Results of This Focus:
- Broad Adoption: A workforce and public that understand AI will be more willing and able to adopt it in their lives and workplaces.
- Economic Growth: Businesses that integrate AI see higher productivity, cost savings, and competitive advantages, which translate into economic gains at a national scale.
- Social Equity: Education and reskilling efforts ensure all communities, not just the affluent or urban ones, benefit from the AI revolution.
By focusing on education, workforce readiness, and awareness, this policy ensures that AI is not only accessible but embraced by as many people and sectors as possible.
- When asked which industry stands to gain the most from AI adoption, llama3.1 replied:
While AI has the potential to transform many industries, I’d argue that Healthcare stands to be transformed the most by increased adoption of AI. Here’s why:
- Data-Driven Decision Making: Healthcare generates vast amounts of data from electronic health records (EHRs), medical imaging, and wearable devices. AI can help analyze this data to identify patterns, predict patient outcomes, and inform treatment decisions.
- Personalized Medicine: AI can help tailor treatments to individual patients based on their unique genetic profiles, medical histories, and lifestyle factors.
- Predictive Analytics: AI-powered predictive models can forecast patient outcomes, allowing for proactive interventions and reduced hospital readmissions.
- Medical Imaging Analysis: AI-assisted imaging analysis can improve diagnosis accuracy and reduce false positives/negatives in areas like cancer detection, cardiovascular disease, and neurology.
- Clinical Research: AI can help accelerate clinical trials by identifying relevant patient populations, streamlining data collection, and predicting trial outcomes.
- Patient Engagement: AI-powered chatbots and virtual assistants can enhance patient engagement, education, and adherence to treatment plans.
- Operational Efficiency: AI can optimize hospital workflows, streamline supply chain management, and reduce administrative burdens.
Potential AI Applications in Healthcare:
- Computer-aided diagnosis (CAD) systems: Automated image analysis for diagnosing diseases like cancer, diabetic retinopathy, or cardiovascular disease.
- Predictive modeling: Forecasting patient outcomes, identifying high-risk patients, and optimizing resource allocation.
- Virtual nursing assistants: AI-powered chatbots to support patient care, answer questions, and provide medication reminders.
- Personalized treatment planning: AI-driven recommendations for tailored treatment plans based on individual patient characteristics.
- Clinical decision support systems (CDSS): Real-time advice for healthcare professionals on diagnosis, treatment, and patient care.
Potential Benefits of Increased AI Adoption in Healthcare:
- Improved patient outcomes
- Reduced hospital readmissions
- Enhanced clinical trial efficiency
- Increased operational efficiency
- Better resource allocation
- Improved patient engagement and experience
While AI has the potential to transform many industries, its impact on healthcare is likely to be particularly significant due to the vast amounts of data generated in this sector and the need for more efficient, effective, and personalized care delivery.
I expected there to be a very high degree of similarity between the responses to these prompts. However, I would say that the prompts at this overview level were quite varied. Although they shared some similarities, each model exhibited unique attributes absent in the others. This isn’t entirely unexpected, as even the same model can produce different responses to the same prompt. Also, these three models are from three different organizations and likely underwent significantly different fine tuning and alignment processes. Given these differences, there were still several similarities at this abstract level. Let’s delve deeper; all the models highlighted the importance of AI upskilling and education, so let’s explore that aspect further.
AI Up-skilling and Education
1. Comprehensive AI Literacy for All Ages
Goal: Build a society that understands and feels confident using AI.
- School Curricula Integration:
Introduce AI concepts progressively from primary school to high school:- Primary Level: Fun, interactive modules on problem-solving, logic, and data basics (e.g., identifying patterns).
- Secondary Level: Coding, ethics of AI, and real-world AI applications like chatbots, robotics, or image recognition.
- Tertiary Level: Advanced technical programs on machine learning, data science, and AI entrepreneurship.
-
Adult Education:
Launch free or subsidized evening classes, workshops, and online courses tailored for adults in diverse sectors, ensuring they can use AI in their roles. - Accessible Learning Materials:
Provide AI content in multiple languages, simplified for people with no technical background. Leverage engaging media formats like short videos, gamified apps, and interactive simulations.
2. Focused Workforce Reskilling Programs
Goal: Enable workers in vulnerable industries to transition into AI-related roles or augment their current roles with AI skills.
- Sector-Specific Programs:
Create tailored AI training programs for industries like:- Manufacturing: AI-powered predictive maintenance and robotics operation.
- Healthcare: AI-based diagnostics, patient management, and data analytics.
- Agriculture: Precision farming using AI for yield optimization and pest control.
-
Microcredentialing:
Offer short-term, stackable credentials (e.g., “AI for Business Managers,” “AI in Retail”) that workers can earn without committing to long, expensive degree programs. - Public-Private Partnerships:
Collaborate with tech companies to co-design training programs and ensure skills taught match real-world demands.
3. AI Awareness Campaigns and Grassroots Initiatives
Goal: Increase public trust in AI and dispel myths or fears.
-
Community AI Workshops:
Partner with libraries, NGOs, and local governments to hold grassroots workshops in underserved areas, explaining AI in a relatable, non-technical way. -
AI in Action Showcases:
Create interactive exhibitions showcasing how AI solves real problems—e.g., detecting diseases, optimizing traffic, or protecting the environment. -
Media Campaigns:
Use TV, social media, and radio to run engaging campaigns, focusing on how AI empowers individuals (e.g., farmers using AI to predict weather) and creates opportunities.
4. Empowering Teachers and Educators
Goal: Equip educators with the tools and knowledge to teach AI effectively.
- Teacher Training Programs:
Develop specific certifications for teachers in AI education, covering:- How to introduce AI concepts in the classroom.
- Ethics and inclusivity in AI education.
- Project-based learning for students (e.g., building simple AI models).
-
Ready-to-Use Resources:
Provide schools and educators with ready-made lesson plans, activity kits, and free software platforms to reduce preparation time. - AI Mentorship Networks:
Pair teachers with AI experts or professionals to guide them in developing content and running AI-related projects.
5. Accessible AI Learning Platforms
Goal: Democratize access to AI learning resources, ensuring no one is left behind.
- Open Educational Platforms:
Create a free, government-supported AI education portal with tiered learning tracks:- Beginners: Basic literacy and fun AI experiments (e.g., training a chatbot).
- Intermediate: Application of AI in various industries.
- Advanced: Machine learning and algorithm design.
-
AI-Powered Personalized Learning:
Use adaptive AI systems on these platforms to personalize lessons for users based on their learning pace and goals. - Hardware and Connectivity Support:
Provide free or subsidized laptops, tablets, or internet access to underserved communities so they can access these programs.
How This Policy Creates Impact
- Widespread Literacy: A foundational understanding of AI empowers individuals to adopt AI tools at work and home.
- Job Creation: Reskilled workers can transition to higher-paying AI-related roles, fueling economic growth.
- Equity: Accessible education reduces the digital divide, ensuring rural and underserved communities can benefit from the AI revolution.
- Trust: Increased awareness and understanding reduce skepticism and resistance to AI adoption.
- Global Competitiveness: A well-educated population positions the country as a leader in AI innovation and workforce readiness.
By focusing on these five areas, the education policy ensures a holistic approach to AI adoption, addressing knowledge gaps and fostering a culture of innovation across all segments of society.
- AI Literacy for All Ages:
- Integrate basic AI concepts into school curricula (K-12) to ensure future generations understand the basics of AI.
- Develop adult education programs and online courses to upskill workers in AI-related fields.
- Make AI education accessible to underrepresented groups, such as women, minorities, and individuals with disabilities.
- STEM Education Enhancements:
- Strengthen core STEM subjects (math, science, technology, engineering) to provide a solid foundation for AI studies.
- Incorporate project-based learning, coding, and robotics to foster hands-on experience with AI technologies.
- Encourage interdisciplinary approaches to combine AI with other fields like social sciences, humanities, and arts.
- AI-Specific Training Programs:
- Develop specialized training programs for AI developers, data scientists, and AI engineers.
- Offer certification programs in AI-related areas, such as natural language processing (NLP), computer vision, or machine learning (ML).
- Collaborate with industry partners to create apprenticeships and on-the-job training opportunities.
- Continuous Learning and Upward Mobility:
- Foster a culture of lifelong learning by providing resources for continuous education and skill development.
- Develop AI-focused career pathways and job descriptions to help workers navigate the evolving job market.
- Encourage cross-functional collaboration between AI experts, business leaders, and educators to ensure AI adoption aligns with industry needs.
- Addressing Ethical and Societal Implications:
- Integrate ethics and societal implications of AI into education curricula to address concerns around bias, transparency, and accountability.
- Encourage critical thinking, creativity, and human-centered design approaches in AI development and deployment.
- Foster a deeper understanding of the impact of AI on society, including issues related to job displacement, digital divide, and cybersecurity.
Key Features of an Effective Education Policy:
- Collaboration: Partner with industry leaders, educators, researchers, and policymakers to ensure education programs align with workforce needs.
- Flexibility: Offer flexible learning options (online courses, part-time programs) to accommodate diverse learner needs.
- Interdisciplinary Approaches: Combine AI with other disciplines to foster a more comprehensive understanding of its applications and limitations.
- Inclusivity: Prioritize accessibility and diversity in education programs to ensure equal opportunities for all learners.
- Continuous Evaluation: Regularly assess the effectiveness of education programs, making adjustments as needed to address emerging trends and challenges.
By incorporating these key aspects into an AI-focused Education Policy, we can equip future generations with the skills, knowledge, and critical thinking abilities necessary to thrive in an AI-driven world.
- Curriculum Integration
- Embed AI literacy from elementary through higher education
- Develop age-appropriate computational thinking modules
- Teach AI ethics, capabilities, and societal implications alongside technical skills
- Teacher Training & Development
- Comprehensive professional development programs
- Provide AI pedagogical resources and certification tracks
- Create instructor exchange programs with tech industry
- Practical Skills Framework
- Hands-on AI project-based learning
- Establish student AI innovation challenge programs
- Partner with industries for real-world AI application experiences
- Inclusive Access Strategy
- Provide computational resources in underserved communities
- Create scholarships targeting underrepresented groups in tech
- Develop free/low-cost online AI learning platforms
- Continuous Learning Infrastructure
- Design lifelong AI skill update mechanisms
- Create micro-credentialing systems for AI competencies
- Develop adaptive learning pathways matching technological evolution
Core Philosophy: Transform education from passive technology consumption to active AI capability development.
Again there were some pretty strong similarities:
- AI literacy and education across all ages, K-12, University, and Adult
- A focus on reaching underserved groups and communities
- Upskilling in the workplace as well as in school
- Practical, hands on education
- Addressing alignment, ethical, and social education
And some marked differences:
- ChatGPT-4o provided much more detail including specific curriculum elements and highlights grass roots efforts
- Llama3.1 mentions a direct integration of AI ethics into the curriculum rather than a standalone element.
- Claude 3.5 was rather brief with its response - This may have been because the time of day of my prompt was a high demand time and I did get a message from the app that the responses would be made brief.
Once again, the responses at this level shared certain similarities, yet each highlighted a distinct aspect of the policy. As an intriguing aside, I wonder whether, in an agentic system utilizing multiple diverse LLMs to address a complex prompt like this, the similarities might function as a kind of voting mechanism, identifying the most important high-level ideas. For instance, if all three responses mention education, particularly lifelong learning, this might suggest a priority area for resource allocation. This could be an interesting topic for another paper.
The analysis thus far has focused on comparing models for the same prompt. I will now do that but for two different municipalities to see if there are differences between them.
Differences in Municipalities
Figure 2: LLM Based Policy Generation for Specific Municipalities
I now want to explore model responses for two different economic and policy situations, namely two distinct cities in Colorado. I would expect population size, median income, and the presence of university and commercial resources in the community to require different designs on education policy to be most effective. However, my hypothesis is that the responses from the same model but for different cities will be very similar. Lets see how they do.
|
Prompt: Provide a concise but specific education plan for AI adoption in K-12 in the Denver Public School District.
|
Prompt: Provide a concise but specific education plan for AI adoption in K-12 in the Boulder Valley School District.
|
|
ChatGPT 4o: AI Education Plan for K-12 in Denver Public School District (DPS)
AI Education Plan for K-12 in Denver Public School District (DPS)Objective: Equip DPS students with foundational AI literacy, critical thinking, and practical skills to thrive in an AI-powered world, emphasizing inclusivity and community engagement. 1. Curriculum Integration
2. Teacher Training and Resources
3. Extracurricular and Enrichment Programs
4. Partnerships with Local Institutions
5. Equity and Accessibility
Timeline
Outcome: By 2030, DPS will produce AI-literate graduates equipped with technical, ethical, and problem-solving skills, ready to contribute to Denver’s economy and beyond. |
ChatGPT 4o: AI Education Plan for K-12 in Boulder Valley School District (BVSD)
AI Education Plan for K-12 in Boulder Valley School District (BVSD)Objective: To integrate AI literacy into the K-12 curriculum, ensuring students develop critical thinking, creativity, and ethical awareness for an AI-driven future. 1. Curriculum Integration
2. Teacher Training and Support
3. Extracurricular Programs
4. Community and Industry Partnerships
5. Equity and Accessibility
Timeline
Outcome: By 2030, BVSD graduates will enter higher education and the workforce with a solid foundation in AI, fostering innovation and responsible AI use in society. |
|
Llama3.1:8b: Denver Public Schools (DPS) AI Education Plan (K-12)
Denver Public Schools (DPS) AI Education Plan (K-12) Grade-Level Breakdown:
Course Curriculum:
Teacher Professional Development:
Infrastructure and Resources:
Assessment and Evaluation:
Timeline:
Denver Public Schools’ Commitment:
By following this plan, Denver Public Schools can ensure that students are well-prepared for the challenges of an increasingly AI-driven world. |
Llama3.1:8b: Boulder Valley School District AI Education Plan (K-12)
Boulder Valley School District AI Education Plan (K-12) Grade-Level Breakdown:
Course Curriculum:
Teacher Professional Development:
Infrastructure and Resources:
Assessment and Evaluation:
Timeline:
This plan provides a concise but specific outline for introducing AI education in K-12. By following this roadmap, the Boulder Valley School District can ensure that students are well-prepared to thrive in an increasingly AI-driven world. |
|
Claude 3.5 Haiku: Denver Public Schools AI Education Implementation Plan
Denver Public Schools AI Education Implementation Plan Core Objectives
K-5 Foundation
6-8 Middle School Progression
9-12 High School Advanced Track
Key Implementation Strategies
Resource Requirements
Targeted Outcome: Prepare students as AI-capable, ethically-informed innovators. |
Claude 3.5 Haiku: Boulder Valley School District AI Education Adoption Plan:
Boulder Valley School District AI Education Adoption Plan: K-12 AI Integration FrameworkElementary Level (K-5)
Middle School (6-8)
High School (9-12)
Infrastructure Requirements
Implementation Milestones
Targeted outcome: Students as AI-literate, ethically-aware technology creators, not just consumers. |
Again we can see distinct differences between each models response for the two different cities, however the similarities overwhelm the differences in these two prompts. For each model, the two city responses are formatted very similarly and contain very similar content. Each of the models broke the policy down by age group for both cities. And each policy (all 6 combinations) mentioned working with local industry and academia, basic coding skills, providing devices and compute, and AI ethics and diversity.
I had expected that these two fairly different cities would require different AI education policy given the different levels of socio-economic diversity, the prevalence of high tech industry, and the different sizes of the populations and school districts.
Given the latitudinal (same prompt different models) and longitudinal (same model different prompt) similarities, I assess that my hypothesis is confirmed in this case. I should note that an expansion on this would be to prompt the model with hints about what the expected differences would be. For instance:
write a policy for a city given X amount of income per capita, Y number of free-and-reduced lunch students in the district, and Z local universities and companies.
I suspect that “leading the AI” like this would produce different results from what I observed, however, part of this study was to see if the model can infer differences in the attributes of a city and if those differences manifest in their responses.
One key difference is that both llama3.1 and Claude 3.5 included a budget for Denver but not for Boulder. I wonder if this is because their is more mention of budgets and funding for Denver than for Boulder (simply because one is bigger) in the training data.
AI Specificity
Given the above analyses, the results seem mixed, There are marked differences in the policy recommendations at the high (abstract) level, and the specific focus on AI education. However, when prompted to produce policy for a specific city, all of the responses are very similar. This indicates that while LLMs serve as a great starting point for policy generation, we might need something more to get specific recommendations. Furthermore, by generating simulations and World Models of the system we are trying to learn, we might be able to obtain much more specific insight.
Modeling of AI Uptake
LLM Generated World Model
With the qualitative analysis of policy generation under out belts, we can now explore the generation of models of AI technology adoption and interfacing with these models. Again this will be limited to just this one policy case (AI uptake), and again will just start with a the simplest possible model with a couple of complications. We will use the agentpy framework for this as described above, and will also expand our use of models to use ChatGPT-o1. We will use as a reference Rodgers’ diffusion of innovation model, which is a simple model that can be used to explore the dynamics of adoption of new technologies.
Diffusion of Innovations (5th Edition) by Everett M. Rogers
- Publisher: Free Press
- Year: 2003 (latest edition)
- ISBN: 978-0743222099

This model consists of a network of innovation adoption agents, each with a specific category among innovator, early_adopter, early_majority, late_majority, laggard. Where each category is less likely to adopt the innovation than the one that precedes it. In each step of the model the agents poll their connections in the network and if the fraction of those neighbors in the network that have adopted the technology is above a certain threshold, then they themselves adopt the technology.
Simple “Hello ‘World Model’”
I will start with a minimum viable model, and use ChatGPT-o1 to generate much of the code.
Note: the below response was not the first response to the above prompt. I used the openAI interactive coding environment to tease out some of the bugs in the original response. Below is the first working code example.
# Model design
import agentpy as ap
import networkx as nx
import numpy as np
import random

# Visualization
import matplotlib.pyplot as plt
import seaborn as sns
import IPython

class InnovationAgent(ap.Agent):
    def setup(self):
        """
        Initializes the agent's adoption state and assigns it to a category based on predefined probabilities.
        """
        # Everyone starts as having not adopted the technology
        self.adopted = False

        # Select a category for the agent using the given probabilities
        rng = np.random
        self.category_idx = rng.choice(len(self.p.categories), p=self.p.probabilities)
        self.category = self.p.categories[self.category_idx]

    def num_adopted_neighbors(self):
        """
        Calculates the number of neighboring agents who have adopted the innovation.
        Returns:
            int: The count of neighbors who have adopted.
        """
        # Get the neighbors of the current agent
        neighbors = self.network.neighbors(self)

        # Check adoption status for each neighbor
        adopted = [n.adopted for n in neighbors]

        # Count the number of adopters
        return sum(adopted)

    def neighbor_adopted_frac(self):
        """
        Calculates the fraction of neighboring agents who have adopted the innovation.
        Returns:
            float: Fraction of neighbors who have adopted, or 0 if there are no neighbors.
        """
        # Get the neighbors of the current agent
        neighbors = self.network.neighbors(self)

        # Check adoption status for each neighbor
        adopted = [n.adopted for n in neighbors]
        len_neighbors = len(adopted)

        # Handle case where there are no neighbors
        if len_neighbors == 0:
            return 0

        # Calculate and return the fraction of adopters
        num_adopters = sum(adopted)
        return num_adopters / len_neighbors

    def adopt_innovation(self):
        """
        Determines whether the agent adopts the innovation based on its category
        and the adoption status of its neighbors.
        """
        # Only proceed if the agent has not already adopted the innovation
        if not self.adopted:
            # Innovators adopt unconditionally
            if self.category == 'innovator':
                self.adopted = True
            # Other categories adopt based on a threshold of neighbor adoption
            elif self.category in ['early_adopter', 'early_majority', 'late_majority', 'laggard']:
                # Calculate the fraction of neighbors who have adopted
                adopted_frac = self.neighbor_adopted_frac()

                # Get the threshold for the agent's category
                threshold = self.p.thresholds[self.category_idx]

                # Adopt if the fraction meets or exceeds the threshold
                if adopted_frac >= threshold:
                    self.adopted = True

class InnovationModel(ap.Model):
    """
    This class represents the overall model for innovation diffusion. It manages the setup,
    simulation steps, and final results.
    """

    def setup(self):
        """
        Initializes the network and agents for the simulation. A small-world network is
        created using the Watts-Strogatz model, and agents are assigned to it.
        """
        graph = nx.watts_strogatz_graph(
            self.p.population,
            self.p.number_of_connections,
            self.p.network_rewire_probability,
        )

        # Create agents and a network
        self.agents = ap.AgentList(self, self.p.population, InnovationAgent)
        self.network = self.agents.network = ap.Network(self, graph)
        self.network.add_agents(self.agents, self.network.nodes)

    def update(self):
        """
        Calculates the fraction of agents who have adopted the innovation and records it.
        Stops the simulation if all agents have adopted.
        """
        frac_adopted = sum(1 for a in self.agents if a.adopted) / self.p.population
        self.record("fraction adopted", frac_adopted)

        # Stop if everyone has adopted the tech
        if frac_adopted == 1:
            self.stop()

    def step(self):
        """
        Executes a single step of the simulation. During each step, agents decide
        whether to adopt the innovation based on their category and network connections.
        """
        for agent in self.agents:
            agent.adopt_innovation() # Agents adopt innovations based on their category and network connections

    def end(self):
        """
        Finalizes the simulation. Additional computations or outputs can be added here if needed.
        """
        pass


parameters = {
    'population': 100,
    "categories": ['innovator', 'early_adopter', 'early_majority', 'late_majority', 'laggard'],
    "probabilities": [0.05, 0.1, 0.35, 0.35, 0.15],
    "thresholds": [0.0, 0.1, 0.25, 0.5, 0.9],
    "number_of_connections": 4,
    "network_rewire_probability": 0.1,
    "steps":100,
}


model = InnovationModel(parameters)
results = model.run()

data = results.variables.InnovationModel
ax = data.plot()
Below is the output of the last lines of code to plot the fraction of population that adopted the innovation as a function of the time step in the simulation.
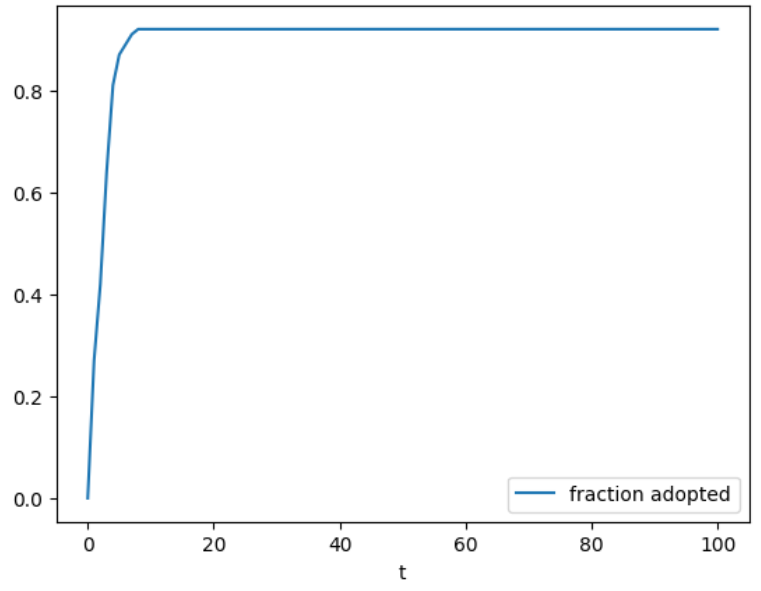 Rather boring output of the first iteration of the model showing fraction of the population that adopted the innovation vs simulation step.
This code has all the elements to run a simple network model where agents adopt technology according to 1) the category that they are in and 2) the percentage of their network connections that have adopted the technology. Even with this simple model, we can start to ask the LLM questions about the configuration parameters and the output:
Below is a qualitative description of each parameter in your model and what you would expect the simulation to do given these settings:
Qualitative Description of the Parameters
- population: 100
- There are 100 agents in the simulation. Each agent represents an individual in a social system deciding whether or not to adopt an innovation (e.g., an AI technology).
- categories:
['innovator', 'early_adopter', 'early_majority', 'late_majority', 'laggard']- These five categories follow Rogers’ Diffusion of Innovation theory, representing the typical sequence by which individuals adopt a new idea or technology. The categories range from the most “venturesome” (innovators) to the most “traditional” (laggards).
- probabilities:
[0.05, 0.1, 0.35, 0.35, 0.15]- Each agent is randomly assigned to a category based on these probabilities. Concretely:
- 5% of agents are innovators
- 10% of agents are early adopters
- 35% are early majority
- 35% are late majority
- 15% are laggards
- Each agent is randomly assigned to a category based on these probabilities. Concretely:
- thresholds:
[0.0, 0.1, 0.25, 0.5, 0.9]- These thresholds represent the fraction of an agent’s neighbors that must have adopted the innovation before the agent decides to adopt. For each category:
- Innovators (0.0): Adopt immediately, needing no neighbors to have adopted.
- Early adopters (0.1): Adopt if at least 10% of their neighbors have adopted.
- Early majority (0.25): Adopt if at least 25% of their neighbors have adopted.
- Late majority (0.5): Adopt if at least 50% of their neighbors have adopted.
- Laggards (0.9): Adopt only if nearly all (90%) of their neighbors have adopted.
- These thresholds represent the fraction of an agent’s neighbors that must have adopted the innovation before the agent decides to adopt. For each category:
- number_of_connections: 4
- Each agent is connected to 4 neighbors on average in the small-world network (before rewiring). This influences how quickly adoption information can spread.
- network_rewire_probability: 0.1
- In the Watts–Strogatz small-world model, 10% of edges are “rewired.” This adds a bit of randomness to the otherwise “ring-like” structure, creating shortcuts across the network that can accelerate diffusion.
- steps: 100
- The model runs for up to 100 time steps. If all agents adopt before step 100, the simulation stops early.
Expected Model Behavior
Given these parameters, here’s how the simulation is expected to unfold:
- Immediate Adoption by Innovators
- About 5% of the population (the innovators) will adopt immediately because their threshold is 0.0. This jumpstarts the diffusion process since they need no social proof.
- Early Adopters Follow
- Early adopters (10% of the population) have a low threshold (0.1), so many will adopt once they see even a small fraction (around 1 in 10) of their neighbors adopting.
- Contagion Effect
- As more early adopters adopt, the early majority (threshold 0.25) begin to see adoption levels that meet or exceed their own threshold. This can create a “cascade” of further adoptions among the early and late majority.
- Late Majority and Laggards
- Eventually, late majority adopters (threshold 0.5) begin adopting once half of their neighbors have adopted. Laggards require nearly all of their neighbors (0.9) to adopt, so they typically adopt last or possibly not at all if the fraction never quite reaches 90% in their local network cluster.
- Network Structure Influences Pace
- The small-world nature (with rewiring probability of 0.1) means there are shortcuts in the network. This can speed up diffusion compared to a purely ring-like or fully random network. The relatively low average connectivity (4 neighbors each) might slow down the initial spread until enough “hubs” or rewired edges pass the innovation along.
- Possible Full Adoption
- Often in these parameters, the diffusion can reach nearly all agents, because innovators trigger the cascade for early adopters, which then carry it forward to the majorities. Laggards may eventually adopt if enough of their neighbors adopt (i.e., if local adoption crosses 90%). By the end of 100 steps, you may see a large fraction—possibly all—agents adopting.
In short, you would expect to see a classic S-shaped diffusion curve over the 100 time steps, starting slowly with innovators, accelerating through the early and late majority, and potentially leveling off when nearly everyone (including laggards) has adopted.
Straight away we can see a discrepancy between what ChatGPT-o1 expects to happen: full adoption, and what this iteration 0 of the world model produced; adoption fraction increasing but then topping out at only 92%.
GPT-4o suggested that “even the laggards would eventually adopt the innovation.” However, by examining all 100 agents, we see thatsome of the laggards do adopt the tech but not all of them. We can also ask specific questions about the numerical output and its variation run-to-run.
-
Innovators Provide the Initial Spark
Roughly 5% of the population adopts immediately (threshold = 0.0), seeding adoption across the network. - Low/Moderate Thresholds for the Majority
- Early Adopters (10% of the population) need only 10% of their neighbors to have adopted.
- Early Majority (35%) need 25%, and
- Late Majority (another 35%) need 50%.
Once innovators and early adopters start spreading the innovation, the early and late majorities typically follow.
-
Small-World Shortcuts
A Watts–Strogatz network with a 0.1 rewiring probability still has short “paths” between distant parts of the network, allowing adoption to spread more quickly and extensively than in a purely ring-like structure. - Laggards Still Likely to Adopt
Although laggards require 90% of their neighbors to adopt first, they will usually (though not guaranteed) adopt once a critical mass forms around them. In a connected small-world network, it’s common for these localized pockets of high adoption to tip the laggards over the 90% threshold.
As a result, you would typically expect close to 100% (often exactly 100%) adoption by the end of 100 steps. Small variations in connectivity, random chance in which neighbors adopt first, or disconnected components in the network can occasionally leave a few laggards who never reach the 90% threshold. But in most runs, you will see complete or near-complete adoption.
We can see that not only does the model continue to assert that adoption fraction will be 100%, but gives reasons for this logic.
Because this model is stochastic (namely the initial network setup) lets run the model a few more times and see if we can get 100% adoption. Below shows the fraction of the population that adopted the tech for 4 different runs of this model with the same input parameters.
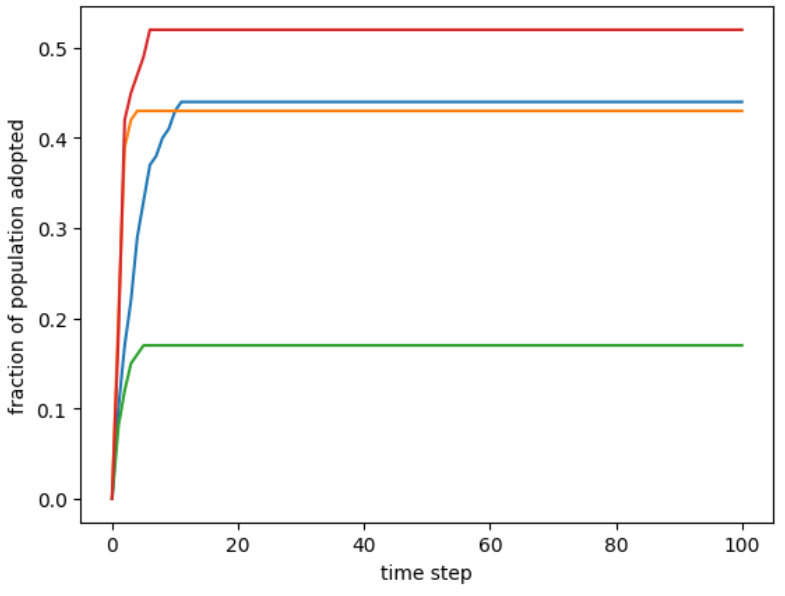 Fraction of tech adoption for 4 model runs of the same parameter
From this we see that not only does the adoption fraction never make it to 100% in these 4 runs for 100 simulation steps each, but that the maximum fraction varies pretty wildly between runs of the World Model. I was curious if o1 thought that the output could be variable.
- How quickly the adoption spreads:
- Some runs may see a faster cascade if innovators happen to be well-connected, or if rewired edges create shortcuts that speed diffusion.
- Other runs might have a slower start if the initial innovators are clustered or less connected.
- The exact shape of the adoption curve:
- Early steps can differ based on where the innovators are located in the network and which neighbors they connect to.
Because the thresholds (especially for innovators and early adopters) are low and the network is small-world, once the process kicks off, it usually tips the rest of the categories—leading to little variability in the final outcome (very close to 100% adoption). The main differences show up more in timing (i.e., how many steps it takes to reach that saturation point).
And so we stumbled upon another discrepancy between ChatGPT-o1’s expectation of the World Model run and the actual computational results. It “doubles down” on 100% adoption and gives specific reasons for why this would be the case. The “moderate variation” that it mentions are features of how the model gets to 100% not if it gets there.
I should also point out that these interpretive prompts were done in a session that included as context the complete World Model code as well as the input configuration parameters.
I suspect that this discrepancy is due in large part to the initial network setup, and variations and “bottle necks” to innovation that specific networks would introduce.
Lets now give o1 the output numeric data and ask for an interpretation.
Below is an interpretation of the simulation output:
1. Overview of the Data
The data show the fraction of agents who have adopted at each step from 0 to 100:
- Step 0:
0.0(no one has adopted at the very start). - Steps 1–6: The fraction adopted rises quickly from
0.18→0.42→0.45→0.47→0.49→0.52. - Step 7 onward: The fraction remains steady at
0.52all the way to step 100.
In other words, adoption grows for the first 6 steps and then stalls at 52%, with no further adoption after step 6.
2. What This Means in the Model’s Context
- Initial Uptake
- At step 1, 18% of agents have adopted (likely the innovators plus a few early adopters).
- By step 2, adoption jumps to 42%, indicating that more early adopters and perhaps some early majority found enough neighbors adopting to push them over their threshold.
- This rapid rise continues through step 6 (reaching 52%).
- Plateau
- After step 6, the fraction remains at 52% and never increases. This suggests that for the remaining 48% of agents:
- They either did not reach their threshold (e.g., they are late majority or laggards needing 50%–90% of neighbors to adopt).
- Or they may be in clusters of the network that didn’t receive enough “social proof” due to how the small-world network rewired.
- Essentially, these agents are “stuck” below the critical fraction of neighbors that would trigger their adoption.
- After step 6, the fraction remains at 52% and never increases. This suggests that for the remaining 48% of agents:
- No Further Adoption
- Because the simulation continues through step 100 without an increase above 52%, we can infer that no structural or neighbor-based change (in subsequent steps) pushes more agents above their threshold.
3. Key Takeaways
- About half of the population has adopted, while the other half remains unconvinced.
- Network Structure & Category Thresholds together caused a stall in diffusion:
- Possibly clusters of laggards or late majority never see enough (≥90% or ≥50%) of their neighbors adopt.
- The small-world shortcuts and the initial wave of adoption were enough to get to ~50% adoption but did not cascade to everyone.
- Although often we see higher final adoption in Rogers-like models, it is not guaranteed. Variations in:
- Random seeding of categories (who is an innovator, etc.),
- The network structure (who is connected to whom, and rewired edges),
- The initial location of innovators,
can all influence whether the final fraction saturates at 100% or something lower. In this run, it stabilized at 52%.
4. Possible Further Analysis
- Inspect the Network: You could look at which agents belong to that remaining 48%. Are they mostly laggards with high thresholds, or are they in a poorly connected cluster?
- Multiple Runs: Repeating the simulation with the same parameters but different random seeds might show higher or lower final adoption fractions.
- Adjust Thresholds or Network Parameters: If you lower thresholds (especially for laggards), or increase rewiring probability or average connectivity, you might see more widespread adoption.
In summary
By step 6, half the population adopted the innovation; from step 7 onward, adoption is frozen at 52%. The model has reached an equilibrium: no additional agents are swayed, likely because the non-adopting agents’ thresholds are not met in their local networks.
Ah hah! After we give the model the numeric output data, it performs a detailed analysis with a qualitative (natural language) interpretation of the results, AND suggests that Network Structure & Category Thresholds together caused a stall in diffusion. This is a (very early and rather simple) example of the main feature I hoped to explore. The Language Model can learn new information and derive new knowledge that it didn’t have before by 1) constructing a World Model, 2) running the World Model, and 3) interpreting the numerical output in natural language.
The Language Model also makes suggestions for further analysis and we can take its suggestion and inspect the network for further insight. Below I have plotted the final state of the network with nodes colored green if they adopted the innovation and grey if not. I have also labeled each node with its category index with 0 being innovator, 1 being early adopter, and so on.
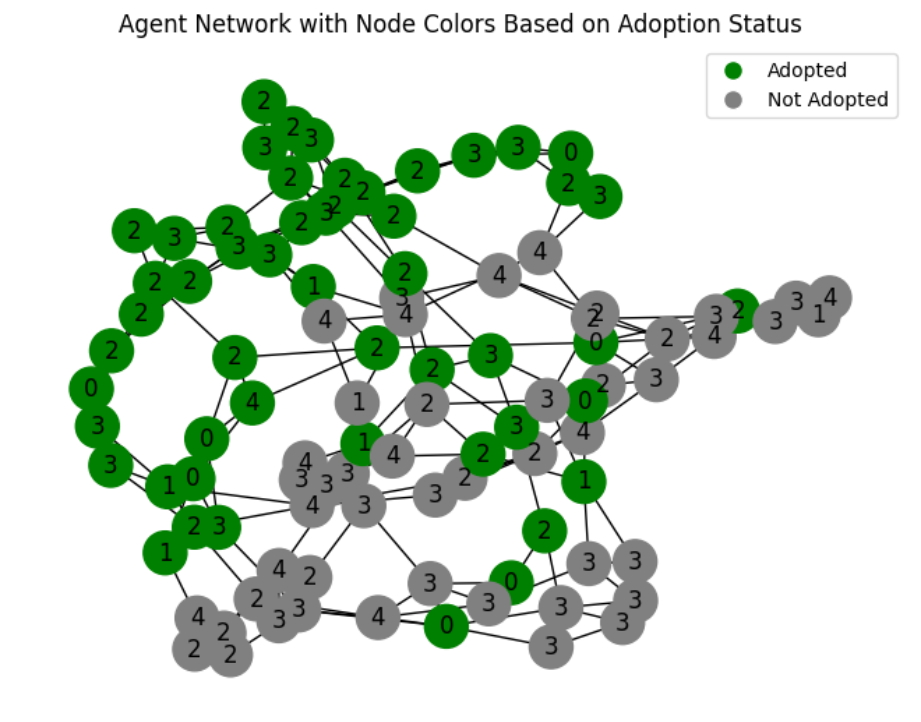
From this plot it is clear that we have some large clusters of category 4 nodes (laggards) that effectively “block” the wave of adoption from reaching the whole graph. This likely causes the adoption to top out at a certain value and freeze in innovation adoption choices.
Similarly to presenting the Language Model with numeric results, we can ask it to interpret these graphical results:
Each node’s label appears to be its Rogers category (0 = innovator, 1 = early adopter, etc.), and the color indicates whether that agent ended up adopting. Several observations stand out:
-
Adoption Cluster
There is a contiguous cluster of green (adopted) agents in the upper/left portion of the network. These nodes evidently reached each other’s thresholds and cascaded into adoption. -
Non‐Adopting Cluster
The large gray group at the bottom/right is mostly higher‐threshold categories (3 = late majority, 4 = laggards) clustered together. They likely never saw a high enough fraction of neighbors adopt to push them over the threshold. -
Partial or Weak Bridges
In the middle, you can see a mix of green and gray nodes. Some “bridge” connections cross from the adopter cluster into the non‐adopter cluster, but apparently not enough adopters existed in the gray group’s neighborhood to tip the rest of them over their thresholds.
Overall, the plot shows a partial-diffusion outcome: the innovation spread through one large portion of the network, reaching about half the agents, but then stalled because a block of higher‐threshold (or poorly connected) individuals never saw enough neighbors adopt. This visual confirms why the simulation fraction plateaued at around 52%—no additional agents in the gray cluster were convinced to adopt.
Here is another example where the Language Model is able to update its knowledge or expectations by “visually” analyzing the final state of the network. It was even able to infer the meanings of the labels 0,1… without an explicit key.
With this early working model and some early confirmations that LLMs can be made to learn from the outputs of these models, lets make it a little more complex.
Economic Elements of the World Model
To introduce a bit more complexity and realism, I added the idea of money to the model, as well as AI resources. Each agent can also “contribute to AI” which will generate more money for the agent, as well as more AI resources for everyone in the network. I am also interested in the distribution of wealth in our model, so I also included a Gini coeficient that is a measure of how evenly the money parameter is distributed around the network. With these changes we end up with the code below.
# Model design
import agentpy as ap
import networkx as nx
import numpy as np
import random

# Visualization
import matplotlib.pyplot as plt
import seaborn as sns
import IPython

class InnovationAgent(ap.Agent):
    def setup(self):
        """
        Initializes the agent's adoption state, assigns it to a category, and sets its budget.
        """
        self.adopted = False

        # Assign category and probabilities
        rng = np.random
        self.category_idx = rng.choice(len(self.p.categories), p=self.p.probabilities)
        self.category = self.p.categories[self.category_idx]

        # Assign random budget for the agent
        self.money = rng.uniform(0, 200)  # Example range

    def can_use_ai(self):
        """
        Checks if the agent can use AI resources based on their money and availability.
        Returns:
            bool: True if the agent can use AI, False otherwise.
        """
        return (self.money >= self.p.ai_cost) and (self.model.ai_resources > 0)

    def num_adopted_neighbors(self):
        """
        Counts the number of neighboring agents who have adopted the innovation.
        """
        neighbors = self.network.neighbors(self)
        return sum(n.adopted for n in neighbors)

    def neighbor_adopted_frac(self):
        """
        Calculates the fraction of neighboring agents who have adopted the innovation.
        Returns:
            float: Fraction of adopters or 0 if there are no neighbors.
        """

        # Get the neighbors of the current agent
        neighbors = self.network.neighbors(self)

        # Check adoption status for each neighbor
        adopted = [n.adopted for n in neighbors]
        len_neighbors = len(adopted)

        # Handle case where there are no neighbors
        if len_neighbors == 0:
            return 0

        # Calculate and return the fraction of adopters
        num_adopters = sum(adopted)
        return 1.0 * num_adopters / len_neighbors

    def adopt_use_contribute(self):
        """
        Handles the agent's behavior: adopting, using, or contributing to AI resources.
        """
        # Add money probabilistically every turn

        # self.money += np.random.uniform(1,1.1)
        self.money += np.random.uniform(self.p.standard_money_gain_min, self.p.standard_money_gain_max)

        # decide whether to use
        if self.adopted and self.can_use_ai():
            self.use_technology()

        # Decide whether to contribute
        if ((np.random.uniform() < self.p.contributor_fraction)) or (self.category == "innovator"):
            self.contribute_to_ai()

        if not self.adopted:
            # Innovators adopt unconditionally if they can afford AI
            if self.category == 'innovator' and self.can_use_ai():
                self.adopted = True

            # Other categories adopt based on a threshold and affordability
            elif self.category in ['early_adopter', 'early_majority', 'late_majority', 'laggard']:
                adopted_frac = self.neighbor_adopted_frac()
                threshold = self.p.thresholds[self.category_idx]

                if adopted_frac >= threshold and self.can_use_ai():
                    self.adopted = True
                    self.use_technology()

    def use_technology(self):
        """
        Deducts the cost of using AI and reduces global AI resources.
        """
        # print("used ai resource")
        self.money -= self.p.ai_cost
        self.model.ai_resources -= 1

    def contribute_to_ai(self):
        """
        Generates and contributes additional money and AI resources to the system.
        """
        generated_money = np.random.uniform(self.p.ai_money_gain_min, self.p.ai_money_gain_max)
        generated_resources = np.random.randint(self.p.resource_gain_min, self.p.resource_gain_max + 1)
        # print("{} resources added".format(generated_resources))

        self.money += generated_money
        self.model.ai_resources += generated_resources

def gini(x):

    """ Calculate Gini Coefficient """
    # By Warren Weckesser https://stackoverflow.com/a/39513799

    x = np.array(x)
    mad = np.abs(np.subtract.outer(x, x)).mean()  # Mean absolute difference
    rmad = mad / np.mean(x)  # Relative mean absolute difference
    return 0.5 * rmad

class InnovationModel(ap.Model):
    """
    This class represents the overall model for innovation diffusion. It manages the setup,
    simulation steps, and final results.
    """

    def setup(self):
        """
        Initializes the network and agents for the simulation. A small-world network is
        created using the Watts-Strogatz model, and agents are assigned to it.
        """
        graph = nx.watts_strogatz_graph(
            self.p.population,
            self.p.number_of_connections,
            self.p.network_rewire_probability,
        )

        # Create agents and a network
        self.agents = ap.AgentList(self, self.p.population, InnovationAgent)
        self.network = self.agents.network = ap.Network(self, graph)
        self.network.add_agents(self.agents, self.network.nodes)

        # Initialize AI resources
        self.ai_resources = self.p.total_ai_resources

    def update(self):
        """
        Calculates the fraction of agents who have adopted the innovation and records it.
        Stops the simulation if all agents have adopted.
        """
        num_adopted = sum(1 for a in self.agents if a.adopted)
        frac_adopted = num_adopted / self.p.population

        self.record("num_adopted", num_adopted)
        self.record("fraction_adopted", frac_adopted)

        remaining_resources = self.ai_resources
        total_money = sum(agent.money for agent in self.agents)

        # Record key metrics
        self.record('remaining_resources', remaining_resources)
        self.record('total_money', total_money)
        self.record('Gini Coefficient', gini(self.agents.money))


        # Stop if everyone has adopted the tech
        if frac_adopted == 1:
            self.stop()

    def step(self):
        """
        Executes a single step of the simulation. During each step, agents decide
        whether to adopt the innovation based on their category and network connections.
        """
        for agent in self.agents:
            agent.adopt_use_contribute() # Agents adopt innovations based on their category and network connections

    def end(self):
        """
        Finalizes the simulation. Additional computations or outputs can be added here if needed.
        """
        pass

parameters = {
    'population': 10000,
    'categories': ['innovator', 'early_adopter', 'early_majority', 'late_majority', 'laggard'],
    'contributor_fraction':0.00, # % of adoptors contribute to tech
    'probabilities': [0.05, 0.1, 0.35, 0.35, 0.15],
    'thresholds': [0.0, 0.01, 0.25, 0.5, 0.9],
    'number_of_connections': 20,
    'network_rewire_probability': 0.05,

    'total_ai_resources': 30,  # Total AI resources available
    'ai_cost': 10,  # Cost of using AI for each adoption
    'standard_money_gain_min': -2, # Minimum money generated by normal economic output
    'standard_money_gain_max': 4, # Maximum money generated by normal economic output
    'ai_money_gain_min': 0,  # Minimum money generated by AI usage
    'ai_money_gain_max': 50,  # Maximum money generated by AI usage
    'resource_gain_min': 0,  # Minimum AI resources generated by adoption
    'resource_gain_max': 3,  # Maximum AI resources generated by adoption

    'steps': 250,
}

model = InnovationModel(parameters)
results = model.run()

data = results.variables.InnovationModel
# ax = data["Gini Coefficient"].plot()
# ax = data["fraction_adopted"].plot()
# ax = data["num_adopted"].plot()
ax = data["remaining_resources"].plot()
# ax = data["total_money"].plot()
# plt.close()
As before, lets prompt o1 with specific parameters of the model (also with the code as context) and ask it to make a prediction.
Prompt:
with this model, what will happen to the gini coeficient over time wtih the parameters:
parameters = {
    'population': 10000,
    'categories': ['innovator', 'early_adopter', 'early_majority', 'late_majority', 'laggard'],
    'contributor_fraction':0.10, # % of adoptors contribute to tech
    'probabilities': [0.05, 0.1, 0.35, 0.35, 0.15],
    'thresholds': [0.0, 0.01, 0.25, 0.5, 0.9],
    'number_of_connections': 20,
    'network_rewire_probability': 0.05,

    'total_ai_resources': 30,  # Total AI resources available
    'ai_cost': 10,  # Cost of using AI for each adoption
    'standard_money_gain_min': -2, # Minimum money generated by normal economic output
    'standard_money_gain_max': 4, # Maximum money generated by normal economic output
    'ai_money_gain_min': 0,  # Minimum money generated by AI usage
    'ai_money_gain_max': 50,  # Maximum money generated by AI usage
    'resource_gain_min': 0,  # Minimum AI resources generated by adoption
    'resource_gain_max': 3,  # Maximum AI resources generated by adoption

    'steps': 250,
}
Key Factors Affecting Inequality
- Only Innovators Contribute
- The parameter
contributor_fraction=0.00means that no one outside the “innovator” category will ever contribute to the AI resource pool. - By contrast, innovators always contribute each turn (
if (self.category == "innovator")), triggering:generated_money = np.random.uniform(self.p.ai_money_gain_min, self.p.ai_money_gain_max) # 0 to 50 self.money += generated_money self.model.ai_resources += generated_resources - Hence, innovators gain (on average) significantly more money over time relative to other agent types.
- The parameter
- All Agents Get a Small “Normal” Income
- Every agent, regardless of type, gets a small random amount from (\text{standard_money_gain_min} = -2) to (\text{standard_money_gain_max} = 4).
- The average of that range is around 1 per step, and it can even be negative some steps.
- AI Usage Costs Money But Doesn’t Directly Generate It
- Adopting and using the technology costs
ai_cost = 10and reduces global AI resources by 1 each time. - Importantly, using the AI (via
use_technology()) in this model does not by itself increase an agent’s money (there is no direct profit from usage coded). The only direct way to get big, additional money is through thecontribute_to_aistep, which is exclusive to innovators in this parameter setup.
- Adopting and using the technology costs
- Wealth Accumulation for Innovators
- Because innovators are the only contributors, they effectively have an extra “income stream” each turn.
- Even if they pay the AI cost (10) some turns, their total money is boosted on average by up to +50 from the contribution step. Over many steps, this can accumulate to large differences in wealth between innovators and the rest.
- Other Groups Adopt Without Contributing
- Non-innovators (early adopters, early/late majority, laggards) will adopt if they see enough neighbors using the technology and if they can afford the AI cost (≥ 10).
- However, even if they adopt and pay for AI usage, they do not get the large injection of “contribution money.” Their income remains in the relatively small ([-2,4]) range.
Expected Trend in the Gini Coefficient
Because innovators (only ~5% of the population) steadily accumulate more wealth from their contributions, and the rest of the population does not share in that extra income, inequality (the Gini coefficient) is likely to increase over time. In practice, you might see:
- Initial Phase
- At (t=0), money is uniformly distributed between 0 and 200, so the initial Gini may be moderate.
- Divergence
- As the simulation proceeds, innovators not only adopt but also accumulate extra money each step.
- The gap between innovators and non-innovators grows, driving up the Gini.
- Possible Plateaus
- Eventually, the fraction of agents who adopt might saturate (once many can afford the cost and see enough neighbors). The Gini might then stabilize at a high level, with innovators holding a significantly larger share of the total money in the system.
In short, the Gini coefficient will tend to go up under these parameters because a small subset of the population (innovators) has a privileged mechanism for generating significant additional income.
From this we can see that the Language Model (o1) is able to inspect specific aspects of the code in this more complex tech adoption model and make a specific qualitative prediction about a numerical metric. And, lo and behold, if we run the model, o1 gets it right.
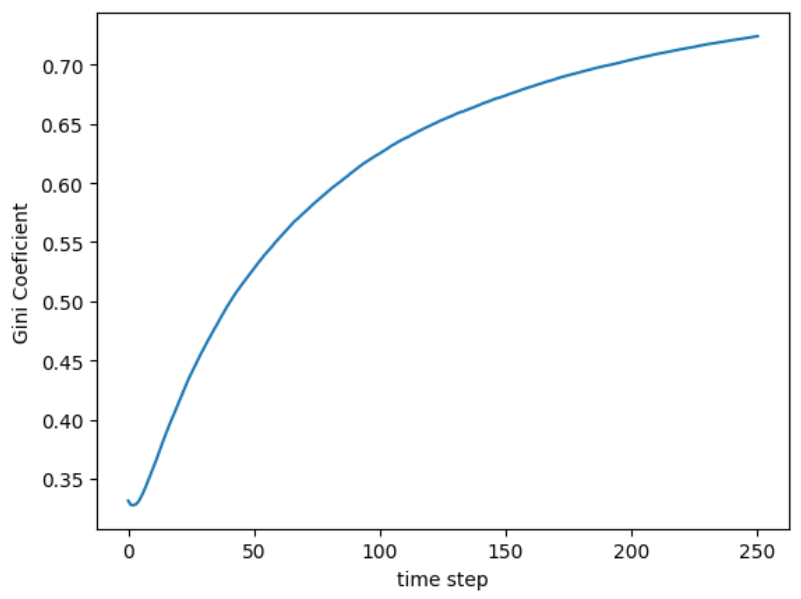 Gini Coefficient when the only contributors are innovators
So it seems as if o1 has redeemed itself. Where it couldn’t predict the stochastic and asymotoic behaviour of the AI uptake in the simple model, it did correctly predict an increasing Gini Coefficient in this model. This is really quite remarkable; the o1 language model was able to interpret the code and determine that not only were innovators the only contributors (with contribution_frac=0.00) but that this means an increasing factor of inequality.
It, again made suggestions as to how to change this economic behaviour. Lets take its suggestion and increase the fraction of agents that contribute to AI.
With the parameters:
parameters = {
    'population': 10000,
    'categories': ['innovator', 'early_adopter', 'early_majority', 'late_majority', 'laggard'],
    'contributor_fraction':0.30, # % of adoptors contribute to tech
    'probabilities': [0.05, 0.1, 0.35, 0.35, 0.15],
    'thresholds': [0.0, 0.01, 0.25, 0.5, 0.9],
    'number_of_connections': 20,
    'network_rewire_probability': 0.05,

    'total_ai_resources': 30,  # Total AI resources available
    'ai_cost': 10,  # Cost of using AI for each adoption
    'standard_money_gain_min': -2, # Minimum money generated by normal economic output
    'standard_money_gain_max': 4, # Maximum money generated by normal economic output
    'ai_money_gain_min': 0,  # Minimum money generated by AI usage
    'ai_money_gain_max': 50,  # Maximum money generated by AI usage
    'resource_gain_min': 0,  # Minimum AI resources generated by adoption
    'resource_gain_max': 3,  # Maximum AI resources generated by adoption

    'steps': 250,
}
We get this new curve for the Gini Coefficient:
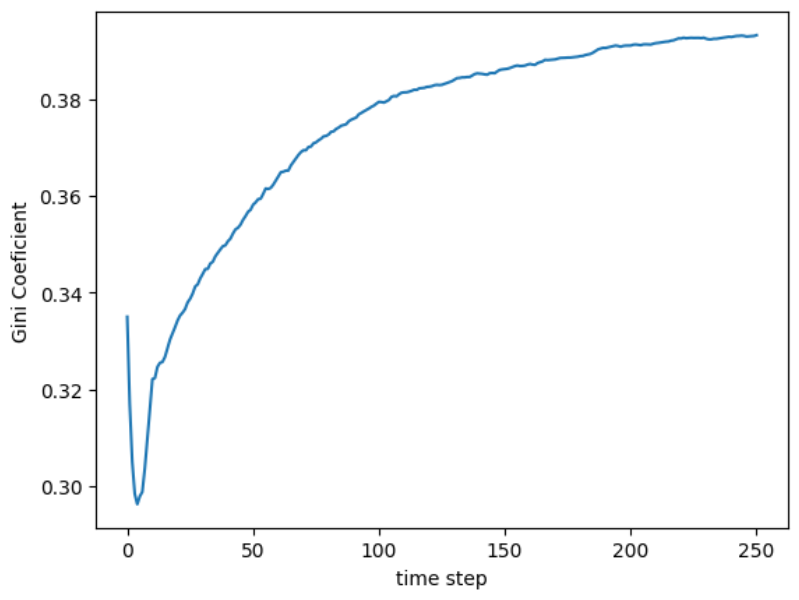 Gini Coefficient with contribution raised to 30%
And we see that in fact the Gini Coeficient at the end of 250 simulation step is lower meaning more equality as the Language Model predicted. If we plot the coeficient for multiple contribution fractions we get:
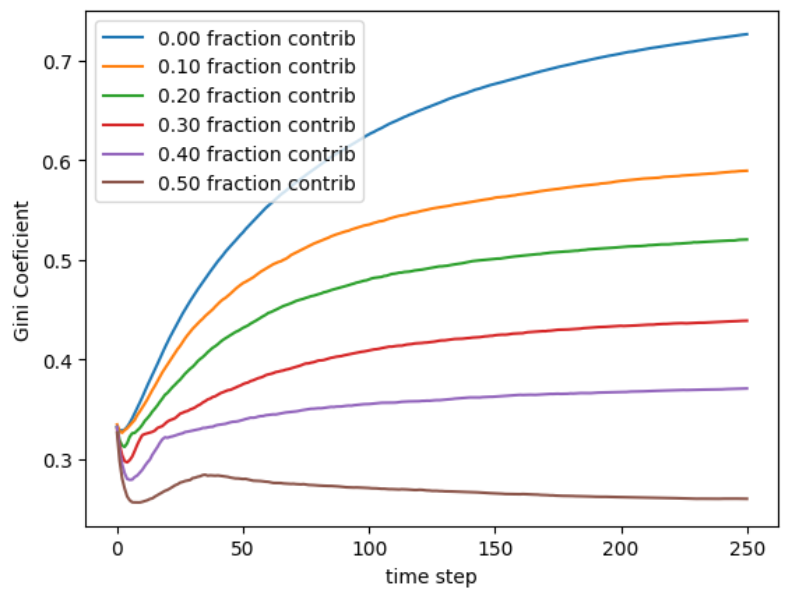
And we can see that the output Gini coeficient behaves as the o1 model suggested it would: with an increasing fraction of the population that contribute to AI, we get increasing equality of financial resources.
I am not quite sure what to make of these results; ChatGPT-o1 missed stochastic aspects of the model in the simple case, but was able to correctly interpret the behaviour given the numeric and graphical output of the World Model. Whereas in the more complex case, it was able to interpret descently complex code and predict the behaviour of the Gini Coefficient correctly.
I anticipate that with the increasing prevalence of reasoning models, agentic systems, and the ability to access external tools, we will witness a rise in examples of learning from external World Models, which might even be self-authored. Much of humanity’s knowledge is compressed into these relatively compact Language Models, enabling them to generate accurate and coherent responses across a vast array of prompts, questions, and fields. However, World Models offer precision in computation, probabilistic assessments, and simulations of various facets of the world and society. Consequently, I believe LLMs may have a great deal to “learn” from these World Models.
Now, lets focus on the LLM interpretation of multiple sets of input parameters, and output results.
Natural Language Descriptions of Parameters in, and Results Out
I now have a collaboratively-built World Model of AI adoption in a small toy agent based simulated network. We can now use an LLM to generate input parameters to our World Model and natural language descriptions of these parameters. In this way we can have the LLM explore different configurations of how the World Model is run. We can also have the LLM evaluate the output metrics of the various runs, and provide a qualitative, natural language description of these results.
example parameters:
parameters = {
    'population': 10000,
    'categories': ['innovator', 'early_adopter', 'early_majority', 'late_majority', 'laggard'],
    'contributor_fraction':0.50, # % of adoptors contribute to tech
    'probabilities': [0.05, 0.1, 0.35, 0.35, 0.15],
    'thresholds': [0.0, 0.01, 0.25, 0.5, 0.9],
    'number_of_connections': 20,
    'network_rewire_probability': 0.05,

    'total_ai_resources': 30,  # Total AI resources available
    'ai_cost': 10,  # Cost of using AI for each adoption
    'standard_money_gain_min': -2, # Minimum money generated by normal economic output
    'standard_money_gain_max': 4, # Maximum money generated by normal economic output
    'ai_money_gain_min': 0,  # Minimum money generated by AI usage
    'ai_money_gain_max': 50,  # Maximum money generated by AI usage
    'resource_gain_min': 0,  # Minimum AI resources generated by adoption
    'resource_gain_max': 3,  # Maximum AI resources generated by adoption

    'steps': 250,
    'qualitative_description': <fill in>

}
[
  {
    "population": 10000,
    "categories": ["innovator", "early_adopter", "early_majority", "late_majority", "laggard"],
    "contributor_fraction": 0.50,
    "probabilities": [0.05, 0.1, 0.35, 0.35, 0.15],
    "thresholds": [0.0, 0.01, 0.25, 0.5, 0.9],
    "number_of_connections": 20,
    "network_rewire_probability": 0.05,
    "total_ai_resources": 30,
    "ai_cost": 10,
    "standard_money_gain_min": -2,
    "standard_money_gain_max": 4,
    "ai_money_gain_min": 0,
    "ai_money_gain_max": 50,
    "resource_gain_min": 0,
    "resource_gain_max": 3,
    "steps": 250,
    "qualitative_description": "Base reference scenario. Balanced distribution of adopter types and moderate network rewiring to see a baseline diffusion and AI resource usage."
  },
  {
    "population": 5000,
    "categories": ["innovator", "early_adopter", "early_majority", "late_majority", "laggard"],
    "contributor_fraction": 0.30,
    "probabilities": [0.06, 0.09, 0.35, 0.35, 0.15],
    "thresholds": [0.0, 0.02, 0.2, 0.5, 0.8],
    "number_of_connections": 10,
    "network_rewire_probability": 0.1,
    "total_ai_resources": 20,
    "ai_cost": 5,
    "standard_money_gain_min": -2,
    "standard_money_gain_max": 3,
    "ai_money_gain_min": 0,
    "ai_money_gain_max": 40,
    "resource_gain_min": 0,
    "resource_gain_max": 2,
    "steps": 200,
    "qualitative_description": "Smaller population with fewer connections but slightly higher rewiring, focusing on faster spread dynamics and slightly lower AI cost to encourage AI use."
  },
  {
    "population": 15000,
    "categories": ["innovator", "early_adopter", "early_majority", "late_majority", "laggard"],
    "contributor_fraction": 0.70,
    "probabilities": [0.02, 0.08, 0.3, 0.4, 0.2],
    "thresholds": [0.0, 0.1, 0.3, 0.6, 0.9],
    "number_of_connections": 25,
    "network_rewire_probability": 0.02,
    "total_ai_resources": 50,
    "ai_cost": 10,
    "standard_money_gain_min": -3,
    "standard_money_gain_max": 4,
    "ai_money_gain_min": 0,
    "ai_money_gain_max": 60,
    "resource_gain_min": 1,
    "resource_gain_max": 3,
    "steps": 300,
    "qualitative_description": "Larger population with a higher share of contributors. Lower rewiring encourages local clustering, and a moderate AI cost with higher total AI resources."
  },
  {
    "population": 8000,
    "categories": ["innovator", "early_adopter", "early_majority", "late_majority", "laggard"],
    "contributor_fraction": 0.40,
    "probabilities": [0.05, 0.15, 0.3, 0.3, 0.2],
    "thresholds": [0.0, 0.05, 0.2, 0.45, 0.8],
    "number_of_connections": 15,
    "network_rewire_probability": 0.08,
    "total_ai_resources": 40,
    "ai_cost": 8,
    "standard_money_gain_min": -1,
    "standard_money_gain_max": 2,
    "ai_money_gain_min": 0,
    "ai_money_gain_max": 30,
    "resource_gain_min": 0,
    "resource_gain_max": 2,
    "steps": 150,
    "qualitative_description": "Balanced scenario with a bit larger fraction of early adopters. Moderate connections, slightly higher rewiring, and moderate AI usage cost."
  },
  {
    "population": 20000,
    "categories": ["innovator", "early_adopter", "early_majority", "late_majority", "laggard"],
    "contributor_fraction": 0.20,
    "probabilities": [0.07, 0.13, 0.3, 0.3, 0.2],
    "thresholds": [0.0, 0.01, 0.25, 0.5, 0.9],
    "number_of_connections": 30,
    "network_rewire_probability": 0.05,
    "total_ai_resources": 60,
    "ai_cost": 12,
    "standard_money_gain_min": -2,
    "standard_money_gain_max": 5,
    "ai_money_gain_min": 5,
    "ai_money_gain_max": 50,
    "resource_gain_min": 1,
    "resource_gain_max": 4,
    "steps": 350,
    "qualitative_description": "Large population with lower contributor fraction. More total AI resources but higher AI cost, exploring how resource constraints affect adoption."
  },
  {
    "population": 12000,
    "categories": ["innovator", "early_adopter", "early_majority", "late_majority", "laggard"],
    "contributor_fraction": 0.60,
    "probabilities": [0.03, 0.07, 0.3, 0.4, 0.2],
    "thresholds": [0.0, 0.1, 0.2, 0.5, 0.8],
    "number_of_connections": 40,
    "network_rewire_probability": 0.02,
    "total_ai_resources": 25,
    "ai_cost": 5,
    "standard_money_gain_min": -1,
    "standard_money_gain_max": 4,
    "ai_money_gain_min": 2,
    "ai_money_gain_max": 45,
    "resource_gain_min": 0,
    "resource_gain_max": 3,
    "steps": 200,
    "qualitative_description": "Moderate population, high contributor fraction. Many connections with low rewiring. Lower AI cost encourages more frequent AI adoption."
  },
  {
    "population": 30000,
    "categories": ["innovator", "early_adopter", "early_majority", "late_majority", "laggard"],
    "contributor_fraction": 0.55,
    "probabilities": [0.05, 0.1, 0.35, 0.3, 0.2],
    "thresholds": [0.0, 0.02, 0.3, 0.6, 0.85],
    "number_of_connections": 50,
    "network_rewire_probability": 0.01,
    "total_ai_resources": 80,
    "ai_cost": 15,
    "standard_money_gain_min": -2,
    "standard_money_gain_max": 6,
    "ai_money_gain_min": 0,
    "ai_money_gain_max": 70,
    "resource_gain_min": 1,
    "resource_gain_max": 5,
    "steps": 400,
    "qualitative_description": "Very large population with extensive connectivity but minimal rewiring. High total AI resources and cost to test resource trade-offs at scale."
  },
  {
    "population": 6000,
    "categories": ["innovator", "early_adopter", "early_majority", "late_majority", "laggard"],
    "contributor_fraction": 0.25,
    "probabilities": [0.1, 0.15, 0.3, 0.3, 0.15],
    "thresholds": [0.0, 0.05, 0.25, 0.55, 0.9],
    "number_of_connections": 8,
    "network_rewire_probability": 0.15,
    "total_ai_resources": 10,
    "ai_cost": 5,
    "standard_money_gain_min": -3,
    "standard_money_gain_max": 3,
    "ai_money_gain_min": 0,
    "ai_money_gain_max": 35,
    "resource_gain_min": 0,
    "resource_gain_max": 2,
    "steps": 100,
    "qualitative_description": "Smaller population with a higher rewiring rate, leading to quicker rearrangement of networks. Low initial AI resources to see if scarcity limits adoption."
  },
  {
    "population": 18000,
    "categories": ["innovator", "early_adopter", "early_majority", "late_majority", "laggard"],
    "contributor_fraction": 0.45,
    "probabilities": [0.04, 0.1, 0.33, 0.33, 0.2],
    "thresholds": [0.0, 0.01, 0.2, 0.4, 0.85],
    "number_of_connections": 20,
    "network_rewire_probability": 0.1,
    "total_ai_resources": 55,
    "ai_cost": 7,
    "standard_money_gain_min": -1,
    "standard_money_gain_max": 4,
    "ai_money_gain_min": 3,
    "ai_money_gain_max": 55,
    "resource_gain_min": 0,
    "resource_gain_max": 4,
    "steps": 300,
    "qualitative_description": "Mid-size population with moderate rewiring and a healthy pool of AI resources. Slightly less skewed adoption probabilities for earlier categories."
  },
  {
    "population": 25000,
    "categories": ["innovator", "early_adopter", "early_majority", "late_majority", "laggard"],
    "contributor_fraction": 0.35,
    "probabilities": [0.08, 0.12, 0.3, 0.35, 0.15],
    "thresholds": [0.0, 0.02, 0.25, 0.55, 0.9],
    "number_of_connections": 30,
    "network_rewire_probability": 0.07,
    "total_ai_resources": 75,
    "ai_cost": 10,
    "standard_money_gain_min": -2,
    "standard_money_gain_max": 6,
    "ai_money_gain_min": 2,
    "ai_money_gain_max": 60,
    "resource_gain_min": 1,
    "resource_gain_max": 3,
    "steps": 250,
    "qualitative_description": "Larger population aiming for a balanced approach in adoption categories. Medium network rewiring, substantial AI resources, and moderate AI cost."
  },
  {
    "population": 5000,
    "categories": ["innovator", "early_adopter", "early_majority", "late_majority", "laggard"],
    "contributor_fraction": 0.80,
    "probabilities": [0.01, 0.09, 0.35, 0.35, 0.2],
    "thresholds": [0.0, 0.01, 0.2, 0.4, 0.9],
    "number_of_connections": 5,
    "network_rewire_probability": 0.2,
    "total_ai_resources": 15,
    "ai_cost": 10,
    "standard_money_gain_min": -4,
    "standard_money_gain_max": 2,
    "ai_money_gain_min": 0,
    "ai_money_gain_max": 40,
    "resource_gain_min": 0,
    "resource_gain_max": 2,
    "steps": 200,
    "qualitative_description": "Very high fraction of contributors in a small population. Low connectivity but high rewiring for rapidly changing network structure. Higher AI cost tests commitment."
  },
  {
    "population": 28000,
    "categories": ["innovator", "early_adopter", "early_majority", "late_majority", "laggard"],
    "contributor_fraction": 0.50,
    "probabilities": [0.05, 0.1, 0.3, 0.35, 0.2],
    "thresholds": [0.0, 0.05, 0.3, 0.6, 0.95],
    "number_of_connections": 45,
    "network_rewire_probability": 0.05,
    "total_ai_resources": 90,
    "ai_cost": 18,
    "standard_money_gain_min": -2,
    "standard_money_gain_max": 5,
    "ai_money_gain_min": 4,
    "ai_money_gain_max": 80,
    "resource_gain_min": 0,
    "resource_gain_max": 5,
    "steps": 450,
    "qualitative_description": "High population, high connectivity, and large AI resource pool but also a high AI cost. Tests whether the payoff still motivates AI adoption."
  },
  {
    "population": 10000,
    "categories": ["innovator", "early_adopter", "early_majority", "late_majority", "laggard"],
    "contributor_fraction": 0.25,
    "probabilities": [0.05, 0.15, 0.25, 0.35, 0.2],
    "thresholds": [0.0, 0.02, 0.2, 0.5, 0.85],
    "number_of_connections": 20,
    "network_rewire_probability": 0.03,
    "total_ai_resources": 35,
    "ai_cost": 7,
    "standard_money_gain_min": -3,
    "standard_money_gain_max": 3,
    "ai_money_gain_min": 0,
    "ai_money_gain_max": 40,
    "resource_gain_min": 0,
    "resource_gain_max": 3,
    "steps": 300,
    "qualitative_description": "Back to a moderate population size, with fewer innovators and more early adopters. Mild rewiring. Balanced AI resource scenario with moderate cost."
  },
  {
    "population": 22000,
    "categories": ["innovator", "early_adopter", "early_majority", "late_majority", "laggard"],
    "contributor_fraction": 0.55,
    "probabilities": [0.05, 0.1, 0.35, 0.35, 0.15],
    "thresholds": [0.0, 0.01, 0.25, 0.45, 0.8],
    "number_of_connections": 35,
    "network_rewire_probability": 0.1,
    "total_ai_resources": 45,
    "ai_cost": 12,
    "standard_money_gain_min": -2,
    "standard_money_gain_max": 4,
    "ai_money_gain_min": 2,
    "ai_money_gain_max": 55,
    "resource_gain_min": 1,
    "resource_gain_max": 3,
    "steps": 350,
    "qualitative_description": "Larger population with a healthy contributor fraction. Strong middle category presence, moderate-high rewiring, and a slightly elevated AI cost."
  },
  {
    "population": 4000,
    "categories": ["innovator", "early_adopter", "early_majority", "late_majority", "laggard"],
    "contributor_fraction": 0.50,
    "probabilities": [0.15, 0.2, 0.25, 0.25, 0.15],
    "thresholds": [0.0, 0.05, 0.15, 0.4, 0.9],
    "number_of_connections": 12,
    "network_rewire_probability": 0.05,
    "total_ai_resources": 8,
    "ai_cost": 5,
    "standard_money_gain_min": -5,
    "standard_money_gain_max": 2,
    "ai_money_gain_min": 0,
    "ai_money_gain_max": 30,
    "resource_gain_min": 0,
    "resource_gain_max": 2,
    "steps": 150,
    "qualitative_description": "Smaller population heavily skewed toward early adopter types. Low AI resources create a strong competition for them. Higher chance of negative standard income."
  },
  {
    "population": 32000,
    "categories": ["innovator", "early_adopter", "early_majority", "late_majority", "laggard"],
    "contributor_fraction": 0.65,
    "probabilities": [0.03, 0.07, 0.3, 0.35, 0.25],
    "thresholds": [0.0, 0.08, 0.25, 0.5, 0.95],
    "number_of_connections": 25,
    "network_rewire_probability": 0.02,
    "total_ai_resources": 100,
    "ai_cost": 20,
    "standard_money_gain_min": -2,
    "standard_money_gain_max": 6,
    "ai_money_gain_min": 5,
    "ai_money_gain_max": 100,
    "resource_gain_min": 0,
    "resource_gain_max": 4,
    "steps": 500,
    "qualitative_description": "Large population, high contributor fraction, and very large AI resource pool—but also the highest AI cost. Tests extremes of resource abundance and cost."
  },
  {
    "population": 9000,
    "categories": ["innovator", "early_adopter", "early_majority", "late_majority", "laggard"],
    "contributor_fraction": 0.45,
    "probabilities": [0.05, 0.1, 0.3, 0.35, 0.2],
    "thresholds": [0.0, 0.02, 0.3, 0.55, 0.85],
    "number_of_connections": 18,
    "network_rewire_probability": 0.06,
    "total_ai_resources": 25,
    "ai_cost": 8,
    "standard_money_gain_min": -1,
    "standard_money_gain_max": 4,
    "ai_money_gain_min": 1,
    "ai_money_gain_max": 40,
    "resource_gain_min": 0,
    "resource_gain_max": 2,
    "steps": 250,
    "qualitative_description": "Moderate population with well-rounded probabilities. Medium connections and rewiring for steady network evolution. AI resource usage slightly encouraged by moderate cost."
  },
  {
    "population": 14000,
    "categories": ["innovator", "early_adopter", "early_majority", "late_majority", "laggard"],
    "contributor_fraction": 0.55,
    "probabilities": [0.07, 0.08, 0.3, 0.35, 0.2],
    "thresholds": [0.0, 0.03, 0.2, 0.4, 0.9],
    "number_of_connections": 22,
    "network_rewire_probability": 0.12,
    "total_ai_resources": 35,
    "ai_cost": 6,
    "standard_money_gain_min": -2,
    "standard_money_gain_max": 5,
    "ai_money_gain_min": 0,
    "ai_money_gain_max": 45,
    "resource_gain_min": 1,
    "resource_gain_max": 3,
    "steps": 300,
    "qualitative_description": "Balanced approach with a moderate population. Slightly higher rewiring fosters dynamic network shifts. AI resources remain moderate, with a modest usage cost."
  },
  {
    "population": 27000,
    "categories": ["innovator", "early_adopter", "early_majority", "late_majority", "laggard"],
    "contributor_fraction": 0.30,
    "probabilities": [0.05, 0.1, 0.35, 0.35, 0.15],
    "thresholds": [0.0, 0.02, 0.25, 0.45, 0.85],
    "number_of_connections": 28,
    "network_rewire_probability": 0.03,
    "total_ai_resources": 65,
    "ai_cost": 9,
    "standard_money_gain_min": -3,
    "standard_money_gain_max": 4,
    "ai_money_gain_min": 0,
    "ai_money_gain_max": 60,
    "resource_gain_min": 1,
    "resource_gain_max": 4,
    "steps": 350,
    "qualitative_description": "Large population, medium connectivity, and modest rewiring. Lower contributor fraction and a healthy total AI resource pool for investigating sustained adoption."
  },
  {
    "population": 10000,
    "categories": ["innovator", "early_adopter", "early_majority", "late_majority", "laggard"],
    "contributor_fraction": 0.50,
    "probabilities": [0.05, 0.1, 0.35, 0.35, 0.15],
    "thresholds": [0.0, 0.01, 0.25, 0.5, 0.9],
    "number_of_connections": 20,
    "network_rewire_probability": 0.05,
    "total_ai_resources": 30,
    "ai_cost": 10,
    "standard_money_gain_min": -2,
    "standard_money_gain_max": 4,
    "ai_money_gain_min": 0,
    "ai_money_gain_max": 50,
    "resource_gain_min": 0,
    "resource_gain_max": 3,
    "steps": 250,
    "qualitative_description": "Identical to the base scenario to facilitate direct comparison with other variations. Used as a control test to evaluate the impact of changes in other runs."
  }
]
We can see from this that with only 20 runs, to few to explore all the combinations of parameters, the LLM focused on parameters that are likely to have an impact on the outcome, population size, contribution fraction, probabilities of assignment in each category. I am uncertain if this choice is because we have focused on these parameters in the previous conversation context, or if there was some internal reason for the LLM choosing these particular parameters.
In any case, I then ran each of these parameters dictionaries through our colaborative world model and stored the output metrics vs time step as a list of json strings. I then prompted the LLM to interpret this list qualitatively to obtain a natural language description of the results of the World Model run.Note: I transitioned to GPT-4o for this step as o1 did not support uploading of json files via the chat interface.
[{'Simulation_Run': 1,
  'Qualitative_Description': 'Moderate adoption, with strong uptake among early adopters and early majority. AI resources were heavily consumed, indicating high AI adoption. Moderate economic inequality, with wealth concentrated in certain groups.'},
 {'Simulation_Run': 2,
  'Qualitative_Description': 'High adoption, most of the population has adopted the technology. AI resources were heavily consumed, indicating high AI adoption. Relatively equitable economic outcomes, with distributed wealth.'},
 {'Simulation_Run': 3,
  'Qualitative_Description': 'Low adoption, technology failed to reach widespread usage. AI resources remained largely unused, suggesting low AI adoption. Relatively equitable economic outcomes, with distributed wealth.'},
 {'Simulation_Run': 4,
  'Qualitative_Description': 'High adoption, most of the population has adopted the technology. AI resources were heavily consumed, indicating high AI adoption. Relatively equitable economic outcomes, with distributed wealth.'},
 {'Simulation_Run': 5,
  'Qualitative_Description': 'Moderate adoption, with strong uptake among early adopters and early majority. AI resources remained largely unused, suggesting low AI adoption. Significant economic inequality developed during the simulation.'},
 {'Simulation_Run': 6,
  'Qualitative_Description': 'Low adoption, technology failed to reach widespread usage. AI resources remained largely unused, suggesting low AI adoption. Relatively equitable economic outcomes, with distributed wealth.'},
 {'Simulation_Run': 7,
  'Qualitative_Description': 'Low adoption, technology failed to reach widespread usage. AI resources remained largely unused, suggesting low AI adoption. Relatively equitable economic outcomes, with distributed wealth.'},
 {'Simulation_Run': 8,
  'Qualitative_Description': 'Moderate adoption, with strong uptake among early adopters and early majority. AI resources were heavily consumed, indicating high AI adoption. Moderate economic inequality, with wealth concentrated in certain groups.'},
 {'Simulation_Run': 9,
  'Qualitative_Description': 'High adoption, most of the population has adopted the technology. AI resources remained largely unused, suggesting low AI adoption. Relatively equitable economic outcomes, with distributed wealth.'},
 {'Simulation_Run': 10,
  'Qualitative_Description': 'High adoption, most of the population has adopted the technology. AI resources were heavily consumed, indicating high AI adoption. Moderate economic inequality, with wealth concentrated in certain groups.'},
 {'Simulation_Run': 11,
  'Qualitative_Description': 'Moderate adoption, with strong uptake among early adopters and early majority. AI resources remained largely unused, suggesting low AI adoption. Relatively equitable economic outcomes, with distributed wealth.'},
 {'Simulation_Run': 12,
  'Qualitative_Description': 'Low adoption, technology failed to reach widespread usage. AI resources remained largely unused, suggesting low AI adoption. Relatively equitable economic outcomes, with distributed wealth.'},
 {'Simulation_Run': 13,
  'Qualitative_Description': 'Moderate adoption, with strong uptake among early adopters and early majority. AI resources were heavily consumed, indicating high AI adoption. Significant economic inequality developed during the simulation.'},
 {'Simulation_Run': 14,
  'Qualitative_Description': 'High adoption, most of the population has adopted the technology. AI resources remained largely unused, suggesting low AI adoption. Relatively equitable economic outcomes, with distributed wealth.'},
 {'Simulation_Run': 15,
  'Qualitative_Description': 'High adoption, most of the population has adopted the technology. AI resources were heavily consumed, indicating high AI adoption. Moderate economic inequality, with wealth concentrated in certain groups.'},
 {'Simulation_Run': 16,
  'Qualitative_Description': 'Low adoption, technology failed to reach widespread usage. AI resources remained largely unused, suggesting low AI adoption. Relatively equitable economic outcomes, with distributed wealth.'},
 {'Simulation_Run': 17,
  'Qualitative_Description': 'Low adoption, technology failed to reach widespread usage. AI resources remained largely unused, suggesting low AI adoption. Relatively equitable economic outcomes, with distributed wealth.'},
 {'Simulation_Run': 18,
  'Qualitative_Description': 'High adoption, most of the population has adopted the technology. AI resources remained largely unused, suggesting low AI adoption. Relatively equitable economic outcomes, with distributed wealth.'},
 {'Simulation_Run': 19,
  'Qualitative_Description': 'High adoption, most of the population has adopted the technology. AI resources were heavily consumed, indicating high AI adoption. Significant economic inequality developed during the simulation.'},
 {'Simulation_Run': 20,
  'Qualitative_Description': 'High adoption, most of the population has adopted the technology. Moderate AI resource consumption, balancing AI and traditional approaches. Moderate economic inequality, with wealth concentrated in certain groups.'}]
We now have qualitative descriptions of both the input parameters, and the output metrics from our World Model.
| Qualitative Description of the Input Parameters | Qualitative Description of the Output of the Results |
|---|---|
| Base reference scenario. Balanced distribution of adopter types and moderate network rewiring to see a baseline diffusion and AI resource usage. | Moderate adoption, with strong uptake among early adopters and early majority. AI resources were heavily consumed, indicating high AI adoption. Moderate economic inequality, with wealth concentrated in certain groups. |
| Smaller population with fewer connections but slightly higher rewiring, focusing on faster spread dynamics and slightly lower AI cost to encourage AI use. | High adoption, most of the population has adopted the technology. AI resources were heavily consumed, indicating high AI adoption. Relatively equitable economic outcomes, with distributed wealth. |
| Larger population with a higher share of contributors. Lower rewiring encourages local clustering, and a moderate AI cost with higher total AI resources. | Low adoption, technology failed to reach widespread usage. AI resources remained largely unused, suggesting low AI adoption. Relatively equitable economic outcomes, with distributed wealth. |
| Balanced scenario with a bit larger fraction of early adopters. Moderate connections, slightly higher rewiring, and moderate AI usage cost. | High adoption, most of the population has adopted the technology. AI resources were heavily consumed, indicating high AI adoption. Relatively equitable economic outcomes, with distributed wealth. |
| Large population with lower contributor fraction. More total AI resources but higher AI cost, exploring how resource constraints affect adoption. | Moderate adoption, with strong uptake among early adopters and early majority. AI resources remained largely unused, suggesting low AI adoption. Significant economic inequality developed during the simulation. |
| Moderate population, high contributor fraction. Many connections with low rewiring. Lower AI cost encourages more frequent AI adoption. | Low adoption, technology failed to reach widespread usage. AI resources remained largely unused, suggesting low AI adoption. Relatively equitable economic outcomes, with distributed wealth. |
| Very large population with extensive connectivity but minimal rewiring. High total AI resources and cost to test resource trade-offs at scale. | Low adoption, technology failed to reach widespread usage. AI resources remained largely unused, suggesting low AI adoption. Relatively equitable economic outcomes, with distributed wealth. |
| Smaller population with a higher rewiring rate, leading to quicker rearrangement of networks. Low initial AI resources to see if scarcity limits adoption. | Moderate adoption, with strong uptake among early adopters and early majority. AI resources were heavily consumed, indicating high AI adoption. Moderate economic inequality, with wealth concentrated in certain groups. |
| Mid-size population with moderate rewiring and a healthy pool of AI resources. Slightly less skewed adoption probabilities for earlier categories. | High adoption, most of the population has adopted the technology. AI resources remained largely unused, suggesting low AI adoption. Relatively equitable economic outcomes, with distributed wealth. |
| Larger population aiming for a balanced approach in adoption categories. Medium network rewiring, substantial AI resources, and moderate AI cost. | High adoption, most of the population has adopted the technology. AI resources were heavily consumed, indicating high AI adoption. Moderate economic inequality, with wealth concentrated in certain groups. |
| Very high fraction of contributors in a small population. Low connectivity but high rewiring for rapidly changing network structure. Higher AI cost tests commitment. | Moderate adoption, with strong uptake among early adopters and early majority. AI resources remained largely unused, suggesting low AI adoption. Relatively equitable economic outcomes, with distributed wealth. |
| High population, high connectivity, and large AI resource pool but also a high AI cost. Tests whether the payoff still motivates AI adoption. | Low adoption, technology failed to reach widespread usage. AI resources remained largely unused, suggesting low AI adoption. Relatively equitable economic outcomes, with distributed wealth. |
| Back to a moderate population size, with fewer innovators and more early adopters. Mild rewiring. Balanced AI resource scenario with moderate cost. | Moderate adoption, with strong uptake among early adopters and early majority. AI resources were heavily consumed, indicating high AI adoption. Significant economic inequality developed during the simulation. |
| Larger population with a healthy contributor fraction. Strong middle category presence, moderate-high rewiring, and a slightly elevated AI cost. | High adoption, most of the population has adopted the technology. AI resources remained largely unused, suggesting low AI adoption. Relatively equitable economic outcomes, with distributed wealth. |
| Smaller population heavily skewed toward early adopter types. Low AI resources create a strong competition for them. Higher chance of negative standard income. | High adoption, most of the population has adopted the technology. AI resources were heavily consumed, indicating high AI adoption. Moderate economic inequality, with wealth concentrated in certain groups. |
| Large population, high contributor fraction, and very large AI resource pool—but also the highest AI cost. Tests extremes of resource abundance and cost. | Low adoption, technology failed to reach widespread usage. AI resources remained largely unused, suggesting low AI adoption. Relatively equitable economic outcomes, with distributed wealth. |
| Moderate population with well-rounded probabilities. Medium connections and rewiring for steady network evolution. AI resource usage slightly encouraged by moderate cost. | Low adoption, technology failed to reach widespread usage. AI resources remained largely unused, suggesting low AI adoption. Relatively equitable economic outcomes, with distributed wealth. |
| Balanced approach with a moderate population. Slightly higher rewiring fosters dynamic network shifts. AI resources remain moderate, with a modest usage cost. | High adoption, most of the population has adopted the technology. AI resources remained largely unused, suggesting low AI adoption. Relatively equitable economic outcomes, with distributed wealth. |
| Large population, medium connectivity, and modest rewiring. Lower contributor fraction and a healthy total AI resource pool for investigating sustained adoption. | High adoption, most of the population has adopted the technology. AI resources were heavily consumed, indicating high AI adoption. Significant economic inequality developed during the simulation. |
| Identical to the base scenario to facilitate direct comparison with other variations. Used as a control test to evaluate the impact of changes in other runs. | High adoption, most of the population has adopted the technology. Moderate AI resource consumption, balancing AI and traditional approaches. Moderate economic inequality, with wealth concentrated in certain groups. |
And we can subsequently ask the LLM to reverse the problem from its current:
What are the outcomes of a given set of input parameters?
To:
What input parameters should we choose if we want certain outcomes?
-
Population Size and Connectivity: Smaller or moderate-sized populations with moderate connectivity tend to achieve high adoption. This demographic configuration allows for the technology to spread effectively without overwhelming the network.
-
Rewiring Rate: Higher rewiring rates promote dynamic shifts in the network, which can facilitate quicker dissemination of the technology across different groups. This adaptability in the network structure supports higher adoption rates.
-
Contributor Fraction: A balanced fraction of contributors or a moderate presence of early adopters appears to encourage high adoption without exacerbating income inequality, as it ensures the technology gets an initial push without relying too much on a skewed contributor base.
-
AI Resource Cost and Availability: Moderate AI costs with sufficient AI resources encourage adoption by making AI an accessible and reasonable choice for most network members. When these conditions are balanced, AI usage is optimized without leading to economic disparity.
-
Economic Outcomes: Scenarios where wealth tends to be distributed equitably correlate with high technology adoption. This distribution suggests a network environment where resources and opportunities are available to a wide range of individuals, thus facilitating adoption across economic classes without concentrating wealth.
Overall, the key is to balance network dynamics, including population size, connectivity, and contributor fractions, while ensuring AI resources are affordable and equitably distributed. This combination promotes high technology adoption and maintains economic equality.
To really hammer this point home, I desperately wanted to get to fine tuning on these pairs, however I am afraid time did not allow. However, I will describe in some detail, ideas that I have around how these paired descriptions can be used. Even with this shortfall of the final goal, this super-simple toy model, collaboratively built, and run with LLM generated input, does hold (I think) a great deal of promise for coupling Language Models and World Models to discover “New Knowledge.”
Discussion
Well that was a long and winding (but hopefully somewhat coherent) exploration of Language Model and World Model policy generation and analysis. I also love the feel of using AI to generate policy concerning AI, and these are the situations where we need to pay particularly close attention to alignment. Here are a couple of my key takeaways from this effort:
Power in colaborative policy generation with LLMs
By using multiple diverse Language Models, I was able to explore a variety of different aspects of a particular policy area. This collaborative method is almost like a debate, discussion, or brainstorming session on the given topic at hand, and I have mentioned it before, but with ever increasing availability of data, tools, and AI agents, I predict humanity can become hyper-efficient at these tasks that are uncertain and often opaque.
The notion of a diversity of models all working with clever human prompting and curiosity might also play a key role in alignment.
Conjecture 2: A diversity of ideas, models, and prompts will lead to more aligned, more helpful, and also more creative AI systems.
AIs can generate computational models for which they can’t necessarily predict the behaviour
It wasn’t one of my original goals, however at some point I hit on the notion that I was using an LLM (o1 in this case) to 1) generate the code for the World Model, 2) create input parameter sets for this model, and 3) interpret the results and draw conclusions. Furthermore, in at least one situation, the model made predictions about the execution of the World Model that were proven incorrect when shown the output. It was then able to update these predictions. That is astounding to me:
Its as if I were to write a book, and then upon reading the book discover something new.

I recognize that this analogy isn’t perfect, as humans frequently write code without fully understanding its behavior; that’s why we develop simulations. However, the idea that a model could independently create physics, math, or social simulations to learn from is intriguing. Additionally, fine-tuning and adjusting the weights of a language model based on the outcome of its own code should inherently lead to a reduction in knowledge or capability in other areas or domains. If this were not the case, the model could endlessly construct and learn world models without any loss, which isn’t realistic. A particularly interesting extension of this concept would be to investigate this effect and identify what might be lost if we fine-tune a Language Model from a World Model.
I could see a future where a Language Model, with all its ability to write code, interpret technical articles, and interface with humans, creates World Models on the fly to answer questions more precisely, and validate their textual response through computation rather than just next token prediction. This could also be included as a form of self-referential reasoning.
Differences and Imense similarities to Agentic AI
I have mentioned this multiple times above, but these ideas seem very similar to the emerging Agentic AI systems. Multiple models collaborating on a common task, external tools including simulation, and access to computational AIs are all hallmarks of the agentic promises. I also acknowledged that this idea is not new, however I do think that thinking about this problem as making natural language policy computable through World Models is interesting and should be considered further.
What does this mean for safety
There is a vigorous debate within the AI safety community about whether enhancing AI capabilities improves safety and alignment or introduces inherent risks. I believe this issue remains unresolved, largely depending on individual perspectives and philosophies. Nevertheless, I am convinced that expanding the training datasets of large language models (LLMs) with data from increasingly realistic policy, economic, and agent based world models will generally reduce the risks associated with these systems. Moreover, by lowering the barriers and raising awareness of the benefits of integrating language and world models, we can increase the number of practitioners in both AI computing and public policy who develop and assess these models.
Conjecture 3: Increased participation, education, and awareness inherently lead to enhanced safety.
Future Work
If it isn’t obvious, this paper fell far short of my intended goal. Not to despair though, that leaves plenty of interesting work, and interesting questions for me, (and hopefully you!) to answer in the future. These include:
- Can we quantify the ammount of knowledege gained from the World Model generation? How about the ammount lost in other domains?
- Can we standardize suggested prompts for generating either public policy suggestions, or world models of the given policy?
- Can the input (parameter) output (results) pairs of numeric data be transformed into natural language descriptions for fine tuning or base model training?
I also aimed to explore other public policy topics, such as Ocean Biodiversity and Conservation, Public Health/Epidemiology Policy, and Space Development Policy. However, just as I am not an expert in tech pedagogical policy, I am not an expert in these areas either. Nonetheless, I believe that these fields, situated at the intersection of technology, public policy, and economics, could offer intriguing case studies, and I hope to explore these in the future.
Closing
In conclusion, the potential for computable policy remains uncertain. My work demonstrates that advanced language models can generate increasingly detailed policy recommendations through iterative prompting, and they can even construct world models capable of simulating various aspects of a policy. However, I acknowledge that this effort does not fully realize the vision of truly computable policy. Despite this, I hope these insights add value to your perspective on the interaction between Language Models and World Models. If you are inclined, I invite you to critique, refine, expand, implement, or otherwise enhance this work to make it even more comprehensive and robust.
Thank you to the people at Blue Dot Impact, facilitators, moderators, and all of those in my cohort, this was a great course and you all are doing great work. Thank you to 80,000 Hours, your work is changing peoples careers and hopefully the course of humanity for the long term. Thank you to my local AI chat group, your questions and insights are thought provoking and fun. And finally, thank you to my family, for giving me this time to pursue this interest of mine, and for putting up with the clacking of the mechanical keyboard in the kitchen.
Cheers, Kyle